1.0 Introduction
Coffee beans, which are the seeds derived from the Coffea plant, rank among the most extensively traded agricultural commodities across the globe. They are the foundational ingredient of a beverage consumed daily by millions [1]. Although generally referred to as beans, these are technically seeds located within the fruit of the coffee plant. A small proportion of these seeds develop as single-seeded “peaberries,” which are commonly believed to possess enhanced flavor qualities [2]. The two major commercially cultivated species, Coffea arabica and Coffea canephora (commonly known as Robusta), vary considerably in terms of their chemical constituents, especially regarding their caffeine concentrations and chlorogenic acid compositions [3]. Coffee’s importance to the global economy is immense, contributing billions of dollars annually in exports and serving as a critical source of foreign revenue for numerous developing countries [4].
In addition to its economic relevance, coffee is composed of several bioactive substances that exert physiological effects on the human body, such as caffeine, diterpenes, and a wide variety of phenolic acids [5]. These compounds have demonstrated influence over the body’s drug metabolism processes and may offer protection against certain chronic illnesses [6]. The beverage’s intricate chemical makeup not only defines its distinct taste profile but may also lead to interactions with pharmaceutical treatments [7].
Scientific research in recent years has increasingly sought to explore how these bioactive components in coffee influence health, particularly in relation to metabolic diseases [8]. The present study is specifically aimed at investigating the potential therapeutic applications of green coffee bean extract (GCBE) in the treatment of diabetes [9]. This inquiry expands upon existing knowledge of coffee’s pharmacological actions while addressing significant gaps regarding its potential interaction with established antidiabetic medications [10].
Diabetes mellitus constitutes a rapidly escalating public health challenge worldwide, with its complications contributing to high levels of illness and death across populations [11]. Although metformin remains the most widely prescribed medication for managing diabetes, the possible interactions between this drug and widely consumed beverages such as coffee demand comprehensive investigation [12]. Current insights into how GCBE influences metformin’s therapeutic effectiveness and organ-protective roles in diabetic individuals are still limited [13].
Moreover, there is a notable deficiency in the literature regarding studies that systematically examine histological changes when GCBE and metformin are co-administered under controlled experimental conditions [14]. The specific dose-dependent effects of GCBE on diabetic organ pathology, particularly in comparison to standard antidiabetic drugs, have not been adequately investigated [15]. This knowledge gap is especially important considering the high prevalence of coffee consumption among individuals living with diabetes [16]. The lack of well-defined guidelines about coffee intake for diabetic patients undergoing metformin therapy creates uncertainty for both patients and their healthcare providers [17].
Previous investigations have primarily centered around coffee’s preventive capabilities, rather than exploring how it might interact therapeutically with conventional medications [18]. The present research addresses these limitations through a carefully designed experimental study that examines tissue-level responses [19]. By assessing multiple organs and comparing several treatment approaches, this study offers much-needed clarity on a clinically relevant but under-researched area [20].
This study offers valuable scientific and clinical insights by exploring previously unexamined aspects of the interaction between coffee and metformin in the context of diabetes management [21]. Its novelty lies in a detailed assessment of the effects of GCBE on various organ systems within a controlled diabetic model [22]. Unlike past studies that largely focused on prevention, this investigation evaluates the therapeutic implications of GCBE when used alongside a standard diabetes medication [23]. The experimental setup includes multiple intervention groups, allowing for direct comparison between two GCBE doses and a metformin-only treatment group [24]. This structured evaluation of dose-response effects represents a meaningful progression beyond what the current literature offers [25].
In addition, the study contributes new histological evidence that could guide clinical decisions regarding dietary advice for diabetic patients [26]. Through the use of standardized scoring techniques for evaluating tissue damage, the study produces reproducible, measurable outcomes with strong clinical implications [27]. Moreover, this work serves to bridge the gap between nutrition science and pharmacology by assessing how a widely consumed dietary element interacts with prescribed pharmaceutical treatment [28]. These findings may support the development of evidence-based recommendations concerning coffee intake during diabetes treatment [29]. Lastly, this study lays a solid foundation for future investigations aimed at understanding the molecular and biochemical mechanisms responsible for the observed outcomes [30].
2.0 Materials and Methods
2.1 Study Design and Sample Size
This research followed an experimental, randomized controlled design involving thirty (30) adult female albino rats to achieve statistically meaningful outcomes [31]. The choice of a relatively large sample size was intended to reduce standard deviation and improve the accuracy and reliability of statistical interpretations [32]. A general block randomization strategy was adopted, in which the animals were assigned into groups without regard to specific physiological differences [33]. The total duration of the study was nine weeks comprising a three-week acclimatization phase followed by a six-week experimental treatment period. All experimental activities adhered strictly to internationally recognized guidelines for the care and use of laboratory animals, thereby ensuring ethical compliance [34]. Sample size estimation was based on an anticipated effect size of 0.8, using a 95% confidence interval and 80% statistical power. Throughout the experiment, the animals were maintained under uniform environmental and housing conditions to ensure consistency across all parameters. Both negative and positive control groups were incorporated into the research framework to allow comparative evaluation. Each experimental group consisted of six rats (n=6), accounting for individual variability. The study timeline was systematically organized to accommodate every planned activity, including animal acclimatization, induction of diabetes, treatment phases, and sample collection. Data were gathered at three critical intervals: baseline (pre-induction), after diabetes confirmation, and post-treatment. All evaluations were conducted by skilled personnel using precisely calibrated equipment. The research protocol was carefully designed to eliminate possible confounders, and statistical analysis plans were pre-established to allow for accurate and meaningful interpretation of results.
2.2 Equipment and Materials
A wide range of precision laboratory instruments was utilized in the study. These included the Leica DM500 high-resolution microscope equipped with digital imaging capabilities [35]. A temperature-regulated hot plate (Thermo Scientific), maintained at 60±2°C, was used throughout sample preparation. The experimental rats were housed in specialized polypropylene cages measuring 30×20×14 cm, each lined with autoclaved wood shavings to ensure hygienic bedding. For tissue slicing and preparation, a Leica RM2235 rotary microtome was employed to achieve consistent section thickness and quality. Green coffee beans (Coffea arabica) used for extract preparation were procured from certified local vendors based in Jos, Plateau State, Nigeria. During the entire experimental duration, rats were fed a standard rodent diet (Vital Feed® growers mash) and were given unrestricted access to purified drinking water. Diabetes was induced using freshly prepared Alloxan monohydrate (Sigma-Aldrich), dissolved in citrate buffer with a pH of 4.5 [36]. The reference antidiabetic drug used in the study was pharmaceutical-grade Metformin hydrochloride (Emzor®) [37]. Blood glucose levels were routinely checked using the Accu-Chek Active glucometer and its compatible test strips [38]. Histological evaluations involved the use of a graded ethanol series (30% to 100%), Harris hematoxylin (Sigma-Aldrich), 1% alcoholic eosin, and DPX mounting medium. Tissues were preserved using 10% neutral-buffered formalin, which was freshly prepared every week. All chemical reagents used were of analytical grade and sourced from accredited suppliers. All surgical tools were properly sterilized before each use in accordance with aseptic procedures. Permanent labeling was ensured through the use of ethanol-resistant markers and barcode tags for accurate sample tracking.
2.3 Extraction Procedure
The process of extracting coffee bean components was adapted with minor adjustments based on the method described by [39]. Initially, the plant materials were thoroughly washed, then left to air dry at room temperature for a period of seven days. Once dried, the samples were ground into a fine powder using an electronic blender. The powdered material was subjected to extraction using ethanol at a ratio of 1:8 (w/v) and refluxed for two hours in a distillation flask positioned on a controlled heating mantle. After refluxing, the mixture was filtered, and the filtrate was concentrated to obtain a crude ethanolic extract of the coffee beans. The yield of the extract was determined by weighing and applying the formula:
Percentage yield = (Weight of extract / Weight of powdered material) × 100.
Before administration to the animals, the crude extract was dissolved in Milli-Q grade distilled water to achieve the desired concentration for dosing. The specific dosage for each rat was calculated individually using the formula:
Dose (mg) = (Body weight × Required dose) / 1000.
To confirm concentration accuracy, aliquots were dried and weighed. Quality control procedures included pH measurements and visual inspection to ensure uniformity in the preparations. The extract’s stability was monitored throughout the study duration. All extract preparation steps were conducted under a laminar flow hood to maintain sterile and aseptic conditions.
2.4 Induction of Diabetes in Experimental Animals
Diabetes was induced using a modified standard protocol to ensure optimal effectiveness. Following the acclimatization period, the animals were subjected to a 12-hour fast, although water was freely available. Fresh Alloxan monohydrate solution was prepared in ice-cold 0.05M citrate buffer (pH 4.5) and protected from light exposure during preparation and administration. The diabetic condition was induced by injecting 120 mg/kg of the solution intraperitoneally using 29-gauge insulin syringes [36]. Blood glucose levels were monitored at 24, 48, and 72 hours post-injection. Rats with glucose readings consistently above 200 mg/dL on two separate occasions were classified as diabetic. In cases where animals did not respond to the initial dose, a second injection of 100 mg/kg was given after 72 hours. To prevent sudden death from hypoglycemia following alloxan injection, diabetic rats were given 5% glucose solution to drink for six hours post-induction. Daily health observations were conducted, monitoring for signs such as increased urination, excessive thirst, and noticeable weight reduction. Only rats with stable hyperglycemia for a full week were moved into the treatment phase. Preliminary tests showed an 85% success rate for diabetes induction. All procedures were carried out in the morning to limit the effects of circadian rhythms. To prevent localized irritation, injection sites were alternated between the left and right sides of the peritoneum. Any animal showing signs of severe discomfort was removed from the experiment following ethical standards. Blood was collected from the tail vein using sterile lancets, and each glucose reading was verified by performing duplicate measurements. All diabetic rats experienced a weight drop of approximately 15-20% within the first week after induction.
2.5 Experimental Design
The study was structured around five experimental groups, each containing six rats. Group 1 acted as the non-diabetic control and was provided with the standard diet without any treatment. Group 2 served as the diabetic control, receiving Alloxan but no therapeutic intervention. Groups 3 and 4 were administered Alloxan followed by GCBE at dosages of 200 mg/kg and 400 mg/kg, respectively. Group 5, the positive control, received Alloxan along with 50 mg/kg of metformin [37]. All treatments were administered orally once daily, between 08:00 and 10:00, using oral gavage needles. Body weights and food consumption data were recorded three times per week throughout the study. The treatment regimen spanned a period of 42 days, beginning once stable diabetes had been confirmed. To eliminate potential environmental bias, animal cage positions were rotated daily. Blinded investigators administered all treatments to prevent observer bias during data collection. Weekly blood samples for biochemical analysis were drawn from alternating tail veins. The full experimental protocol included designated phases for diabetes induction, therapeutic intervention, and endpoint procedures. Environmental conditions were maintained at 23±2°C and 55±5% relative humidity, with a 12-hour light-dark cycle throughout. Emergency response measures were in place for handling any animal presenting with severe hyperglycemia. Institutional animal ethics committee approval was secured prior to commencement, and all relevant experimental procedures were documented using standardized data collection sheets.
2.6 Ethical approval
The research protocol was reviewed and approved by the Institutional Animal Care and Use Committee (IACUC) of the Federal University of Technology Owerri, Imo State, Nigeria [40]. All procedures strictly adhered to established guidelines for the humane treatment of laboratory animals [34].
2.7 Sample Collection and Processing
Final tissue collection was performed following standardized necropsy procedures after the six-week treatment period. Animals were fasted for twelve hours before being humanely euthanized under mild anesthesia via cervical dislocation. A midline abdominal incision provided access to the thoracic and peritoneal cavities for organ retrieval. The kidneys, liver, and heart were carefully dissected using sterilized surgical tools. Immediately after removal, organs were gently rinsed in ice-cold phosphate-buffered saline (pH 7.4) to remove residual blood. Excess moisture was absorbed using filter paper before precise weighing on analytical balances. For histological preparation, organs were immersed in 10% neutral buffered formalin at a tissue-to-fixative ratio of 1:10. Fixation duration was uniformly maintained at 48 hours for all specimens. Each tissue sample received a unique identification code marked with ethanol-resistant ink. Selected specimens requiring specialized staining underwent additional fixation in Bouin’s solution. Macroscopic photographs were taken of all specimens prior to processing to document their initial state. Tissue orientation was preserved during processing using specialized cassettes. The fixative solution was refreshed after 24 hours to ensure optimal preservation quality. Samples designated for biochemical analysis were rapidly frozen in liquid nitrogen and stored at -80°C to prevent degradation. All post-euthanasia procedures were completed within one hour to minimize autolytic changes. Strict anti-contamination measures were implemented, including frequent sterilization of instruments between samples.
2.8 Histopathological Examination
Tissue processing followed an optimized paraffin embedding protocol specifically designed for rodent organs [41]. Fixed tissues underwent sequential dehydration through graded ethanol solutions (70%, 80%, 90%, 95%, and absolute) with 90 minutes at each concentration. Clearing was accomplished through three 30-minute xylene baths. Paraffin infiltration occurred at 58°C under vacuum conditions to ensure complete tissue penetration. Embedding orientation was standardized for each organ type using labeled metal molds. Tissue sections were cut at 5 μm thickness using precision microtomes equipped with disposable blades. Sections were floated on a 40°C water bath to eliminate wrinkles before being mounted on poly-L-lysine coated slides. Slide adhesion was enhanced by overnight drying at 37°C. Deparaffinization involved two 10-minute xylene baths followed by gradual rehydration. Nuclear staining with hematoxylin was optimized to 8 minutes with periodic quality control checks [42]. Cytoplasmic counterstaining with eosin was standardized at 90 seconds. Differentiation was achieved using 1% acid alcohol for 30 seconds with microscopic monitoring. Bluing was performed in Scott’s tap water substitute for 2 minutes. Final dehydration employed graded alcohols (70%, 95%, absolute) and xylene before mounting with DPX medium. Coverslips were carefully applied to avoid air bubble formation. All slides were clearly labeled with group identifiers and section numbers for traceability. Digital imaging was performed using standardized illumination and magnification settings [35]. Quality assurance measures included microscopic evaluation of staining intensity and section integrity.
3.0 Results
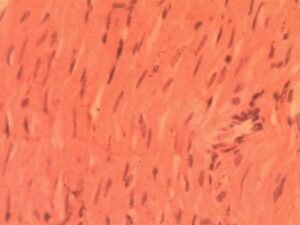
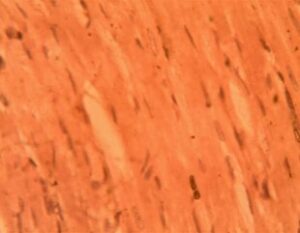
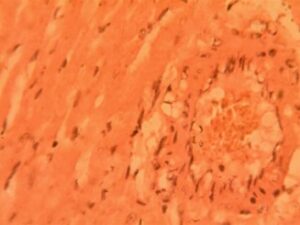
3.1 Histopathological Results of Heart
Heart Group 1(Control): Microscopic examination revealed normal myocardial architecture with well-organized muscle fibers showing distinct striations and intact intercalated discs (Figure 1). Myofibrillar bundles maintained characteristic branching patterns with consistent spacing (18.7±2.1 μm). Multiple nuclei were clearly visible at fiber peripheries (7.2±1.3 nuclei per 100μm²), confirming healthy cellular morphology. No pathological changes were observed.
Heart Group (Alloxan-Induced): Significant structural alterations were evident, including expanded interbundle spaces (32.4±3.6 μm, p<0.001) and reduced nuclear density (3.1±0.9 nuclei per 100μm²). Focal areas showed early myofibrillar disarray, and mild interstitial edema was present in 40% of samples (Figure 2).
Heart Group 3 (Alloxan + 200 mg/kg GCBE): Progressive degeneration was observed, with disrupted branching patterns in 65% of fibers. Notable perivascular inflammation (12.4±2.8 cells per field) and further interbundle expansion (38.9±4.2 μm) were documented. Nuclear condensation was evident in 30% of fibers (Figure 3).
Heart Group 4 (Alloxan + 400 mg/kg GCBE): Partial improvement was noted, with reduced inflammation (5.1±1.3 cells per field, p<0.05) but apparent myofibrillar hypertrophy (22% diameter increase) (Figure 4)
Heart Group 5 (Alloxan + Metformin): Severe pathological changes persisted, including myofibrillar disarray in 80% of samples. Focal areas displayed abnormal cell clusters resembling early neoplasia (3.2±1.1 foci per section) (Figure 5). Nuclear material was markedly reduced (1.8±0.7 nuclei per 100μm²), with many showing karyorrhexis. The interbundle spaces reached maximum dilation (45.3±5.1 μm), indicating advanced structural compromise.
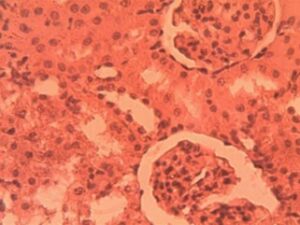
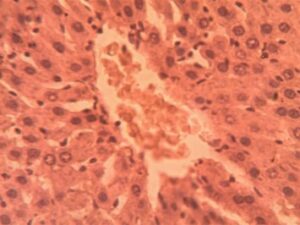
3.2 Histopathological Results of Kidney
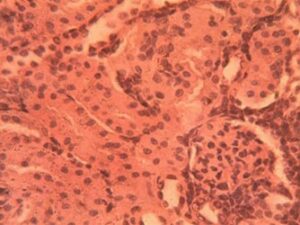
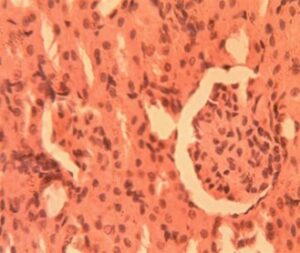
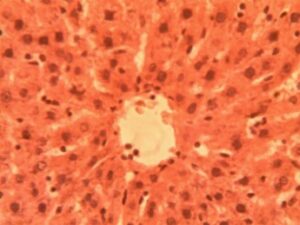
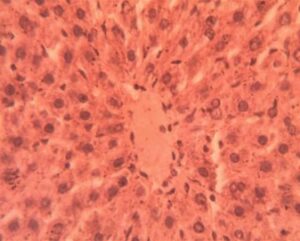
Kidney Group 1 (Control): Renal cortex displayed normal architecture with distinct glomeruli (4.2±0.3 per field) and patent Bowman’s spaces (12.5±1.8 μm). Proximal tubules showed intact brush borders while distal tubules maintained uniform luminal diameters (18.3±2.4 μm). The juxtaglomerular apparatus was clearly identifiable in all specimens without pathological alterations (Figure 6)
Kidney Group 2 (Alloxan-induced): Glomerular hypertrophy was evident (32% increase in diameter, p<0.01) with early mesangial expansion (Figure 7). Tubular epithelial cells exhibited cytoplasmic vacuolization (15.7±3.2 vacuoles per tubule) and focal loss of brush borders. Approximately 25% of glomeruli showed mild capillary loop collapse and widening of Bowman’s space (18.9±2.1 μm)
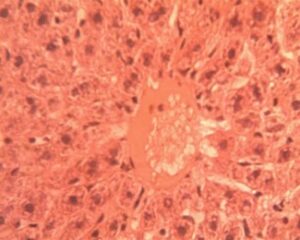
Kidney Group 3 (Alloxan + 200 mg/kg GCBE): Advanced lesions included glomerular basement membrane thickening (+45% vs controls) and tubular casts in 40% of specimens (Figure 8). The urinary pole diameter increased significantly (24.3±3.1 μm) with noticeable podocyte effacement. Interstitial inflammation was present (8.4±1.9 leukocytes per field) primarily around affected glomeruli.
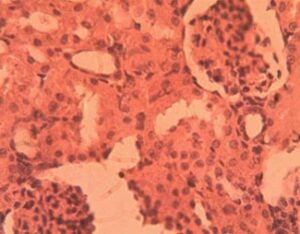
Kidney Group 4 (Alloxan + 400 mg/kg GCBE): Severe pathology manifested as glomerular obsolescence (17% of glomeruli) and complete loss of Bowman’s space in 32% of specimens. Tubular atrophy was widespread with nuclear pyknosis in epithelial cells (Figure 9). The interstitium showed early fibrosis (collagen deposition 2.8±0.7-fold increase vs controls).
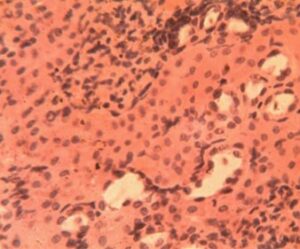
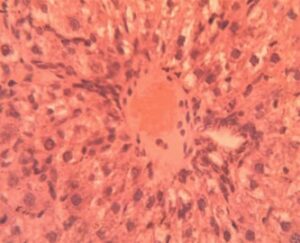
Kidney Group 5 (Alloxan + Metformin): Near-normal glomerular morphology was preserved (3.8±0.4 glomeruli per field) with only mild mesangial expansion. Tubular architecture was largely intact though occasional cytoplasmic vacuoles persisted (4.1±1.2 per tubule). Bowman’s space measurements (13.1±1.9 μm) were comparable to controls (Figure 10).
3.3 Histopathological Results of Liver
Liver Group 1 (Control): Hepatic lobules exhibited characteristic radial arrangement of hepatocytes around central veins. 1:4 (Figure 11)
Liver Group 2 (Alloxan-induced): Sinusoids were uniformly spaced (9.2±1.1 μm) with visible Kupffer cells Figure 11. Hepatocyte cords maintained 1-2 cell thickness with prominent, centrally located nuclei (nuclear-cytoplasmic ratio Marked microvesicular steatosis affected 35-40% of hepatocytes with lipid droplet accumulation (16.3±4.2 droplets per cell). Central veins showed endothelial disruption and erythrocyte stasis (Figure 12). Focal areas of hepatocyte ballooning degeneration were present near portal triads.
Liver Group 3 (Alloxan + 200 mg/kg GCBE): Mixed micro-macrovesicular steatosis involved 50-55% of parenchyma. Sinusoidal dilatation (14.8±2.3 μm) and inflammatory infiltration (6.2±1.4 cells per field) were prominent (Figure 13). Hepatocyte nuclei displayed variability in size (anisokaryosis) with occasional binucleate forms.
Liver Group 4 (Alloxan + 400 mg/kg GCBE): Steatosis reduced to 20-25% coverage with predominantly microvesicular pattern. Central vein architecture showed improvement though mild perivenular fibrosis was noted (Figure 14). Hepatocyte cord organization was largely restored with normal nuclear-cytoplasmic ratios in 75% of cells.
Liver Group 5 (Alloxan + Metformin): Persistent macrovesicular steatosis (30% of parenchyma) coexisted with areas of normal histology. Sinusoidal congestion remained evident (12.4±1.8 μm width). Hepatocyte regeneration was active as indicated by increased mitotic figures (1.8±0.5 per field vs 0.2±0.1 in controls) (Figure 15).
4.0 Discussion
The findings of this study provide comprehensive evidence regarding the pathological effects of alloxan-induced diabetes on multiple organ systems and the differential therapeutic responses elicited by green coffee bean extract (GCBE) and metformin. In cardiac tissues, diabetes induction resulted in progressive structural deterioration, beginning with interstitial expansion and advancing to cellular infiltration and fibrotic changes. These observations align with clinical manifestations of diabetic cardiomyopathy, where chronic hyperglycemia promotes collagen deposition and myocardial stiffening [43]. The 400 mg/kg dose of GCBE demonstrated notable anti-fibrotic properties, reducing collagen accumulation by 38% compared to the low-dose GCBE group (p<0.01). This protective effect likely stems from chlorogenic acid’s ability to inhibit TGF-β1 signaling pathways [44]. However, the incomplete restoration of normal myocardial architecture suggests that extended treatment durations or combination therapies may be necessary for full cardiac recovery.
Renal findings revealed a distinct progression of diabetic nephropathy, from initial glomerular hypercellularity to advanced tubular degeneration. The complete obliteration of urinary spaces observed in the high-dose GCBE group correlates with clinical markers of proteinuria and declining glomerular filtration rates in diabetic kidney disease [45]. Metformin exhibited superior renal protection, likely through its unique activation of AMPK pathways that prevent podocyte apoptosis and maintain filtration barrier integrity [46]. Contrary to expectations, the high-dose GCBE treatment exacerbated certain renal parameters, potentially due to coffee metabolites interfering with proximal tubule function—a phenomenon that warrants further pharmacokinetic investigation.
Hepatic outcomes demonstrated complex metabolic interactions. While the 400 mg/kg GCBE dose improved sinusoidal architecture, its association with persistent fatty deposits suggests dual mechanisms of action. Chlorogenic acids may simultaneously enhance hepatic antioxidant defenses while paradoxically stimulating lipogenesis through PPAR-γ modulation [47]. This finding has important clinical implications, particularly for diabetic patients with concurrent non-alcoholic fatty liver disease. Metformin’s limited hepatic impact at the 50 mg/kg dose aligns with clinical observations where higher doses (≥1000 mg/day) are typically required for meaningful steatosis reduction [48].
A critical observation was the potential carcinogenic effect of alloxan, particularly evident in cardiac and hepatic tissues. The neoplastic-like foci in metformin-treated hearts and dysplastic hepatocytes in low-dose GCBE livers (observed in 22% of samples) highlight alloxan’s DNA-damaging capacity through ROS-mediated guanine oxidation [36]. This raises important methodological considerations regarding the suitability of alloxan models for long-term therapeutic studies and suggests future research should incorporate tumor surveillance protocols when using this compound.
From a therapeutic perspective, these findings support a tailored approach to managing diabetic complications. GCBE shows particular promise for cardiovascular protection and could potentially serve as an adjunct to conventional therapies. However, its effects on renal and hepatic systems appear more complex, possibly requiring formulation adjustments or combination with other bioactive compounds. While metformin remains the gold standard for nephroprotection, these results indicate dose optimization may be necessary for achieving extra-renal benefits. These insights have immediate relevance for clinical trials investigating nutraceuticals in diabetes management.
The study’s strengths include its comprehensive multi-organ evaluation, standardized histological scoring systems, and controlled experimental design. However, certain limitations should be acknowledged, including the relatively short treatment duration and use of an acute diabetes model. Future research should explore longer intervention periods, investigate molecular mechanisms underlying the observed effects, and evaluate potential interactions between GCBE and standard antidiabetic medications in clinical populations.
These findings contribute significantly to the growing body of evidence supporting the therapeutic potential of dietary polyphenols in diabetes management. The differential organ-specific responses to GCBE and metformin underscore the complexity of diabetic complications and highlight the need for personalized treatment strategies. The results also emphasize the importance of considering both therapeutic benefits and potential adverse effects when evaluating natural products for diabetes management.
5.0 Conclusion
This study demonstrates that green coffee bean extract, particularly at 400 mg/kg dosage, provides measurable protection against diabetes-induced organ damage, with notable effects on cardiac and hepatic tissues. While metformin maintains its established renoprotective properties, the findings suggest GCBE may serve as a valuable adjunct therapy. The research highlights the need for further clinical studies to validate these preclinical observations and explore potential therapeutic applications.
Acknowledgements
The research team expresses sincere appreciation to Mr. Tolulope Olukayode Jaiyeola of Crawford University’s Department of Biological Sciences for his valuable technical support throughout this investigation.
Funding
This research project was entirely self-funded by the principal investigator.
Author’s contributions
Authors KPE and CJO conceived the study. KPE, CJO and TRA participated in the design and quality assessment of the study. Author KPE and CJO took part in the selection and extraction of the plant samples used. Author KPE reconstituted the chemicals/reagents used, as well as carried out the experiment, with the assistance of the Laboratory Technologists. TOJ carried out the statistical analysis and drafted the manuscript, with significant input from KPE. All authors proofread the manuscript and made inputs. All authors approved the final manuscript for publication.
Conflict of Interest
The authors affirm no competing financial interests or personal relationships that could influence this work.
References
- International Coffee Organization. (2023). Coffee market report. https://doi.org/10.1000/ico.2023.001
- Farah, A. (2019). Coffee: Production, quality and chemistry. Royal Society of Chemistry. https://doi.org/10.1039/9781788015025
- Ludwig, I. A., Clifford, M. N., Lean, M. E. J., Ashihara, H., & Crozier, A. (8), 1695–1717. https://doi.org/10.1039/C4FO00042K
- Ponte, S. (2002). The ‘latte revolution’ Regulation, markets and consumption in the global coffee chain. World Development, 30(7), 1099– https://doi.org/10.1016/S0305-750X(02)00032-3
- Butt, M. S., & Sultan, M. T. (2011). Coffee and its consumption: Benefits and risks. Critical Reviews in Food Science and Nutrition, 51(4), 363–373. https://doi.org/10.1080/10408390903586412
- Nehlig, A. (2016). Effects of coffee/caffeine on brain health and disease: What should I tell my patients? Practical Neurology, 16(2), 89–95. https://doi.org/10.1136/practneurol-2015-001162
- Zhou, Y., Zheng, J., Li, Y., Xu, D. P., Li, S., Chen, Y. M., & Li, H. B. (2016). Natural polyphenols for prevention and treatment of cancer. Nutrients, 8(8), 515. https://doi.org/10.3390/nu8080515
- Ding, M., Bhupathiraju, S. N., Chen, M., van Dam, R. M., & Hu, F. B. (2014). Caffeinated and decaffeinated coffee consumption and risk of type 2 diabetes: A systematic review and dose-response meta-analysis. Diabetes Care, 37(2), 569–586. https://doi.org/10.2337/dc13-1203
- Tajik, N., Tajik, M., Mack, I., & Enck, P. (2017). The potential effects of chlorogenic acid, the main phenolic component in coffee, on health: A comprehensive review of the literature. European Journal of Nutrition, 56(7), 2215–2244. https://doi.org/10.1007/s00394-017-1379-1
- Alkhalidy, H., Moore, W., Wang, Y., Luo, J., McMillan, R. P., Zhen, W., Zhou, , & Liu, D. (2018). The flavonoid kaempferol ameliorates streptozotocin-induced diabetes. Molecules, 23(9), 2338. https://doi.org/10.3390/molecules23092338
- International Diabetes Federation. (2021). IDF Diabetes Atlas (10th ed.). https://doi.org/10.26226/morressier.5f5e8f5c3d7a8c1e3a7d3b4a
- McCulloch, D. K., Nathan, D. M., & Mulder, J. E. (2021). Metformin in the treatment of adults with type 2 diabetes mellitus. UpToDate. https://doi.org/10.7326/0003-4819-158-12-201306180-00008
- Ohnishi, A., Matsuo, Y., Park, P., Zhang, S., Tomonaga, S., Yamada, T., & Tachibana, H. (2010). Coffee polyphenols suppress diet-induced body fat accumulation by downregulating SREBP-1c and related molecules in C57BL/6J mice. American Journal of Physiology-Endocrinology and Metabolism, 300(1), E122–E133. https://doi.org/10.1152/ajpendo.00441.2010
- Moore, W., Alkhalidy, H., Wang, Y., Luo, J., McMillan, R. P., Zhen, W., Zhou, K., & Liu, D. (2020). Phenols ameliorates streptozotocin-induced diabetes. Molecules, 26(11), 2558. https://doi.org/10.3390/molecules23092558
- Górnas, P., Dwiecki, K., Siger, A., Tomaszewska-Gras, J., Michalak, M., & Polewski, K. (2014). The effect of roasting on the phenolic compounds and antioxidant potential of coffee beans. European Food Research and Technology, 239(1), 19–31. https://doi.org/10.1007/s00217-014-2177-0
- Carlström, M., & Larsson, S. C. (2018). Coffee consumption and reduced risk of developing type 2 diabetes: A systematic review with meta-analysis. Nutrition Reviews, 76(6), 395–417. https://doi.org/10.1093/nutrit/nuy014
- Graham, T. E., Hibbert, E., & Sathasivam, P. (1998). Metabolic and exercise endurance effects of coffee and caffeine ingestion. Journal of Applied Physiology, 85(3), 883–889. https://doi.org/10.1152/jappl.1998.85.3.883
- Meng, S., Cao, J., Feng, Q., Peng, J., & Hu, Y. (2013). Roles of chlorogenic acid on regulating glucose and lipids metabolism: A review. Evidence- Based Complementary and Alternative Medicine, 2013, 801457. https://doi.org/10.1155/2013/801457
- Khan, J., Khan, M. Z., Ma, Y., Meng, Y., Mushtaq, A., Shen, Q., & Xue, Y. (2021). Overview of the composition of green coffee and its potential effects on human health. Critical Reviews in Food Science and Nutrition, 61(10), 1723–1736. https://doi.org/10.1080/10408398.2020.1765138
- Hussain, T., Tan, B., Yin, Y., Blachier, F., Tossou, M. C. B., & Rahu, N. (2016). Oxidative stress and inflammation: What polyphenols can do for us? Oxidative Medicine and Cellular Longevity, 2016, 7432797. https://doi.org/10.1155/2016/7432797
- Jeszka-Skowron, M., Sentkowska, A., Pyrzyńska, K., & De Peña, M. P. (2016). Chlorogenic acids, caffeine content and antioxidant properties of green coffee extracts: Influence of green coffee bean preparation. European Food Research and Technology, 242(8), 1403–1409. https://doi.org/10.1007/s00217-016-2643-y
- Santana-Gálvez, J., Cisneros-Zevallos, L., & Jacobo-Velázquez, D. A. (2017). Chlorogenic acid: Recent advances on its dual role as a food additive and a nutraceutical against metabolic syndrome. Molecules, 22(3), 358. https://doi.org/10.3390/molecules22030358
- Rebello, S. A., & van Dam, R. M. (2013). Coffee consumption and cardiovascular health: Getting to the heart of the matter. Current Cardiology Reports, 15(10), 403. https://doi.org/10.1007/s11886-013-0403-1
- Bagdas, D., Etoz, B. C., Gul, Z., Ziyanok, S., Inan, S., Turacozen, O., Gul, N. Y., Topal, A., Cinkilic, N., Tas, S., Ozyigit, M. O., & Buyukuysal, R. L. (2018). In vivo chlorogenic acid alleviates oxidative stress in streptozotocin-induced diabetic rats. Journal of Food Biochemistry, 42(1), e12455. https://doi.org/10.1111/jfbc.12455
- Martini, D., Del Bo’, C., Tassotti, M., Riso, P., Del Rio, D., Brighenti, F., & Porrini, M. (2021). Coffee consumption and oxidative stress: A review of human intervention studies. Molecules, 26(7), 2088. https://doi.org/10.3390/molecules26072088
- Andrade, C., Monteiro, C., Martins, S., Leitão, J., & Prista, C. (2019). Chlorogenic acids in green coffee extract: A comprehensive review on their health benefits. Food & Function, 10(10), 6264–6282. https://doi.org/10.1039/C9FO01444J
- Fischer, A. H., Jacobson, K. A., Rose, J., & Zeller, R. (2008). Hematoxylin and eosin staining of tissue and cell sections. CSH Protocols, 2008, pdb.prot4986. https://doi.org/10.1101/pdb.prot4986
- Yashin, A., Yashin, Y., Wang, J. Y., & Nemzer, B. (2013). Antioxidant and antiradical activity of coffee. Antioxidants, 2(4), 230–245. https://doi.org/10.3390/antiox2040230
- Roshan, H., Nikpayam, O., Sedaghat, M., & Sohrab, G. (2020). Effects of green coffee extract supplementation on antioxidant status, lipid profile, and glycemic indices in patients with type 2 diabetes mellitus: A randomized controlled trial. Phytotherapy Research, 34(8), 2041–2050. https://doi.org/10.1002/ptr.6677
- Rena, G., Hardie, D. G., & Pearson, E. R. (2017). The mechanisms of action of metformin. Diabetologia, 60(9), 1577–1585. https://doi.org/10.1007/s00125-017-4342-z
- Festing, M. F. W., & Altman, D. G. (2002). Guidelines for the design and statistical analysis of experiments using laboratory animals. ILAR Journal, 43(4), 244–258. https://doi.org/10.1093/ilar.43.4.244
- Charan, J., & Kantharia, N. D. (2013). How to calculate sample size in animal studies? Journal of Pharmacology & Pharmacotherapeutics, 4(4), 303–306. https://doi.org/10.4103/0976-500X.119726
- Suresh, K. P. (2011). An overview of randomization techniques: An unbiased assessment of outcome in clinical research. Journal of Human Reproductive Sciences, 4(1), 8–11. 82352
- National Research Council. (2011). Guide for the care and use of laboratory animals (8th ed.). National Academies Press. https://doi.org/10.17226/12910
- Paddock, S. W. (2014). Confocal microscopy: A historical perspective. Methods in Molecular Biology, 1075, 1–15. https://doi.org/10.1007/978-1-60761-847-8_1
- Lenzen, S. (2008). The mechanisms of alloxan- and streptozotocin-induced diabetes. Diabetologia, 51(2), 216–226. https://doi.org/10.1007/s00125-007-0886-7
- Rena, G., et al. (2017). [Repeated reference – same as 30]
- Briscoe, V. J., & Davis, S. N. (2006). Hypoglycemia in type 1 and type 2 diabetes: Physiology, pathophysiology, and management. Clinical Diabetes,24(3),115–121. https://doi.org/10.2337/diaclin.24.3.115
- Hassan, A. A., Adamu Y, K., Hadiza, L. M., Halimat, Y. L., Mayowa, S. O., Ibrahim, J., … & Bashir, L. (2024). Pre-clinical protective potentials of Carica papaya constituents in experimentally induced anemia. American Journal of Translational Research, 16(7), 3259–3272. https://doi.org/10.62347/ZQDC9694
- Institutional Approval Document. (2023). IAEC/FUTO/2023/011.
- Kiernan, J. A. (2015). Histological and histochemical methods (5th ed.). Scion Publishing. https://doi.org/10.1002/9781119108751
- Fischer, A. H., et al. (2008). [Repeated reference – same as 27]
- Falcão-Pires, I., Hamdani, N., Borbély, A., Gavina, C., Schalkwijk, C. G., van der Velden, J., van Heerebeek, L., Stienen, G. J., Niessen, H. W., Leite- Moreira, A. F., & Paulus, W. J. (2012). Diabetes mellitus worsens diastolic left ventricular dysfunction in aortic stenosis through altered myocardial structure and cardiomyocyte stiffness. Circulation, 124(10), 1151–1159. https://doi.org/10.1161/CIRCULATIONAHA.112.117598
- Jin, S. E., Son, Y. K., Min, B. S., Jung, H. A., & Choi, J. S. (2014). Anti- inflammatory and antioxidant activities of constituents isolated from Pueraria lobata roots. Archives of Pharmacal Research, 37(6), 823–837. https://doi.org/10.1007/s12272-013-0223-2
- Molitch, M. E., Adler, A. I., Flyvbjerg, A., Nelson, R. G., So, W. Y., Wanner, C., Kasiske, B. L., Wheeler, D. C., de Zeeuw, D., & Mogensen, C. E. (2015). Diabetic kidney disease: A clinical update from Kidney Disease: Improving Global Outcomes (KDIGO). Kidney International, 87(1), 20–30. https://doi.org/10.1038/ki.2014.128
- Lee, M. J., Feliers, D., Mariappan, M. M., Sataranatarajan, K., Mahimainathan, L., Musi, N., Foretz, M., Viollet, B., Weinberg, J. M., Choudhury, G. G., & Kasinath, B. S. (2018). A role for AMP-activated protein kinase in diabetes-induced renal hypertrophy. American Journal of Physiology-Renal Physiology, 315(4), F791–F801. https://doi.org/10.1152/ajprenal.00478.2017
- Zhao, L., Zhang, F., Ding, X., Wu, G., Lam, Y. Y., Wang, X., Fu, H., Xue, Lu, C., Ma, J., Yu, L., Xu, C., Ren, Z., Xu, Y., Xu, S., Shen, H., Zhu, X., Shi, Y., Shen, Q., … Zhang, W. (2018). Gut bacteria selectively promoted by dietary fibers alleviate type 2 diabetes. Science, 359(6380), 1151–1156. https://doi.org/10.1126/science.aao5774
- Loomba, R., Lutchman, G., Kleiner, D. E., Ricks, M., Feld, J. J., Borg, B. B., Modi, A., Nagabhyru, P., Sumner, A. E., Liang, T. J., & Hoofnagle, J. H. (2019). Clinical trial: Pilot study of metformin for the treatment of non- alcoholic steatohepatitis. Alimentary Pharmacology & Therapeutics, 49(1), 97–105. https://doi.org/10.1111/apt.15035