1. Introduction
Environmental contamination represents one of the most pressing challenges facing the African continent in the 21st century. Rapid industrialization, urbanization, mining activities, agricultural intensification, and inadequate waste management infrastructure have resulted in widespread contamination of soils, water bodies, and sediments across diverse African ecosystems (Adeola & Olawumi, 2021; Tchounwou et al., 2012; Shobowale et al., 2025). Heavy metals such as lead (Pb), cadmium (Cd), chromium (Cr), mercury (Hg), and arsenic (As) persist indefinitely in the environment and accumulate through food chains, posing severe risks to human health and ecosystem integrity (Ali et al., 2019; Fashola et al., 2016; Obun et al., 2025).
The African continent hosts significant mineral reserves, and mining operations have been a major source of heavy metal contamination. Countries including South Africa, Ghana, Nigeria, the Democratic Republic of Congo, and Zimbabwe have experienced extensive soil and water pollution from mining activities (Amoah-Antwi et al., 2021; Ogola et al., 2002). Petroleum exploration and transportation, particularly in the Niger Delta region of Nigeria, have resulted in widespread hydrocarbon contamination affecting millions of hectares of agricultural land and aquatic ecosystems (Ite et al., 2013; Nwilo & Badejo, 2005).
Agricultural practices across Sub-Saharan Africa involve extensive use of pesticides, many of which are persistent organic pollutants banned in developed nations but still employed due to their low cost and availability (Jepson et al., 2020; Mengistie et al., 2017). The Africa Stockpiles Programme estimated that over 50,000 tonnes of obsolete pesticide stockpiles exist across the continent, representing significant environmental and health hazards (FAO, 2015). Industrial effluents from textile, tannery, and manufacturing facilities further compound the contamination burden, particularly in rapidly industrializing nations such as Egypt, Kenya, and Ethiopia (Elhefny et al., 2019; Wakjira et al., 2020).
Conventional remediation approaches, including excavation and landfilling, soil washing, and chemical treatment, are often prohibitively expensive and may generate secondary pollutants (Dermont et al., 2008; Khalid et al., 2017). Bioremediation, the use of microorganisms to degrade, transform, or immobilize environmental contaminants, has emerged as a sustainable, cost-effective alternative particularly suited to the African context where financial and technological resources may be limited (Abatenh et al., 2017; Ojuederie & Babalola, 2017).
Microorganisms, including bacteria, fungi, and algae, possess diverse metabolic capabilities enabling them to utilize organic pollutants as carbon and energy sources or to transform heavy metals through mechanisms such as biosorption, bioaccumulation, biotransformation, bioleaching, and biomineralization (Ayangbenro & Babalola, 2017; Gadd, 2010). Indigenous microbial communities in contaminated African environments have evolved adaptive mechanisms conferring tolerance and remediation capacity for specific pollutants prevalent in their habitats (Azubuike et al., 2016).
Despite the growing body of literature on microbial bioremediation in Africa, no comprehensive meta-analysis has systematically synthesized the quantitative evidence across pollutant types, microbial taxa, and geographic regions. Individual studies vary considerably in their reported efficacy, experimental designs, and environmental conditions, making it challenging to draw overarching conclusions about the effectiveness of bioremediation strategies across the continent (Megharaj et al., 2011). This meta-analysis addresses this critical knowledge gap by systematically reviewing and quantitatively synthesizing published studies on microbial bioremediation of environmental toxicants in Africa. Specifically, we aim to: (1) determine pooled removal efficiency estimates for heavy metals, petroleum hydrocarbons, pesticides, and industrial effluents; (2) identify the most effective bacterial and fungal taxa for specific contaminant classes; (3) assess geographic patterns and regional disparities in bioremediation research and outcomes across the five African regions; (4) examine sources of heterogeneity through subgroup and moderator analyses; and (5) evaluate the quality and risk of bias in the existing literature.
The findings of this meta-analysis will inform evidence-based recommendations for implementing bioremediation strategies across Africa, identify research gaps requiring attention, and provide a quantitative foundation for policy development addressing environmental contamination on the continent.
2. MATERIALS AND METHODS
2.1. Protocol Registration and Guidelines
This systematic review and meta-analysis was conducted following the Preferred Reporting Items for Systematic Reviews and Meta-Analyses (PRISMA) 2020 guidelines (Page et al., 2021). The protocol was developed a priori and registered with the Open Science Framework (OSF) prior to conducting the literature search. The review methodology adhered to established standards for environmental science meta-analyses as outlined by the Collaboration for Environmental Evidence (CEE) guidelines.
2.2. Eligibility Criteria
Studies were included in this meta-analysis if they met the following criteria:
Population/Setting: Studies conducted in any African country involving contaminated environmental matrices (soil, water, sediment, or wastewater).
Intervention: Application of microbial bioremediation strategies using bacteria, fungi, algae, or mixed microbial consortia for pollutant removal or degradation.
Comparator: Studies with control groups (untreated samples) or baseline measurements allowing calculation of removal efficiency.
Outcomes: Quantitative reporting of removal efficiency (percentage), degradation rate, or sufficient data to calculate these metrics for at least one of the following pollutant categories:
- Heavy metals: Lead (Pb), cadmium (Cd), chromium (Cr), mercury (Hg), arsenic (As), zinc (Zn), copper (Cu), nickel (Ni), manganese (Mn), or iron (Fe)
- Petroleum hydrocarbons: Total petroleum hydrocarbons (TPH), polycyclic aromatic hydrocarbons (PAHs), crude oil, diesel, gasoline, or specific hydrocarbon fractions
- Pesticides: Organochlorines, organophosphates, carbamates, pyrethroids, or herbicides
- Industrial effluents: Textile dyes, tannery waste, or other industrial pollutants with measured removal
Study design: Original research articles including laboratory studies, microcosm experiments, field trials, or pilot-scale applications.
Exclusion criteria comprised: (1) review articles, conference abstracts, book chapters, or non-peer-reviewed publications; (2) studies conducted outside Africa or with ambiguous geographic location; (3) phytoremediation studies without microbial component; (4) studies reporting qualitative results only; (5) studies lacking control groups or baseline data; (6) duplicate publications or subset analyses of previously included datasets.
2.3. Information Sources and Search Strategy
A comprehensive literature search was conducted across four electronic databases: Web of Science Core Collection, Scopus, PubMed/MEDLINE, and Google Scholar. The search was performed between October and November 2024, with database coverage extending to December 2024.
The search strategy combined three concept blocks using Boolean operators:
Block 1 (Intervention): (“bioremediation” OR “biodegradation” OR “biosorption” OR “bioaccumulation” OR “biotransformation” OR “microbial remediation” OR “bacterial remediation” OR “fungal remediation” OR “phytoremediation” OR “mycoremediation”)
Block 2 (Contaminants): (“heavy metal*” OR “lead” OR “cadmium” OR “chromium” OR “mercury” OR “arsenic” OR “petroleum” OR “hydrocarbon*” OR “crude oil” OR “diesel” OR “pesticide*” OR “organochlorine*” OR “industrial effluent*” OR “wastewater” OR “contaminated soil” OR “polluted water”)
Block 3 (Geographic): (“Africa” OR “African” OR “Nigeria” OR “South Africa” OR “Egypt” OR “Kenya” OR “Ghana” OR “Ethiopia” OR “Tanzania” OR “Uganda” OR “Morocco” OR “Algeria” OR “Tunisia” OR “Cameroon” OR “Senegal” OR “Zimbabwe” OR “Namibia” OR “Botswana” OR “Zambia” OR “Malawi” OR “Mozambique” OR “Rwanda” OR “Burkina Faso” OR “Mali” OR “Niger” OR “Chad” OR “Congo” OR “Sudan” OR “Libya” OR “Angola”)
The complete search string was: (Block 1) AND (Block 2) AND (Block 3)
Database-specific syntax modifications were applied as appropriate. Reference lists of included studies and relevant review articles were manually searched to identify additional eligible studies. Authors of studies with incomplete data were contacted for clarification where necessary.
2.4. Study Selection Process
Search results were imported into EndNote reference management software, and duplicate records were removed. Two independent reviewers screened titles and abstracts against the eligibility criteria. Full texts of potentially eligible studies were retrieved and assessed independently by both reviewers. Disagreements were resolved through discussion and, when necessary, consultation with a third reviewer. The study selection process was documented using a PRISMA flow diagram (Figure 1), recording the number of records at each stage: identification, screening, eligibility assessment, and final inclusion.
2.5. Data Extraction Process
A standardized data extraction form was developed and piloted on a subset of ten studies before full implementation. Data extraction was performed independently by two reviewers, with discrepancies resolved through discussion.
The following data were extracted from each included study:
Study characteristics: First author, publication year, journal, study design (laboratory/field), study duration.
Geographic information: Country, African region (North, West, East, Central, or Southern), specific location/site, ecosystem type (soil, freshwater, marine, wastewater).
Contaminant details: Pollutant class (heavy metal, petroleum hydrocarbon, pesticide, industrial effluent), specific pollutant(s), initial concentration, final concentration.
Microbial intervention: Microorganism type (bacteria, fungi, algae, consortium), genus and species identification, bioremediation approach (bioaugmentation, biostimulation, natural attenuation), inoculum concentration.
Environmental conditions: pH, temperature, incubation time, nutrient amendments.
Outcomes: Removal efficiency (%), degradation rate, statistical measures (mean, standard deviation, sample size).
For studies reporting multiple outcomes (e.g., different pollutants, time points, or microbial strains), each outcome was extracted as a separate data point for analysis.
2.6. Risk of Bias Assessment
Risk of bias in individual studies was assessed using an adapted version of the Office of Health Assessment and Translation (OHAT) Risk of Bias Rating Tool, modified for environmental microbiology studies. Assessment domains included:
- Selection bias: Adequacy of control group selection and baseline comparability
- Performance bias: Consistency in experimental conditions across treatment groups
- Detection bias: Blinding of outcome assessors and validated analytical methods
- Attrition bias: Completeness of outcome data and handling of missing data
- Reporting bias: Selective reporting of outcomes
- Other bias: Contamination between groups, inappropriate statistical analysis
Each domain was rated as “low risk,” “probably low risk,” “probably high risk,” or “high risk” of bias. Studies with high-risk ratings in two or more domains were classified as having overall high risk of bias. Assessment was performed independently by two reviewers, with Cohen’s kappa calculated to evaluate inter-rater reliability.
2.7. Statistical Analysis
2.7.1. Effect Size Calculation
Removal efficiency (RE%) was the primary outcome measure, calculated as:
RE% = [(Ci – Cf) / Ci] × 100
where Ci is initial contaminant concentration and Cf is final concentration. For studies reporting RE% directly, this value was extracted. For studies reporting only concentration data, RE% was calculated from provided values.
Effect sizes were transformed using the logit transformation to stabilize variance and ensure approximate normality:
logit(RE) = ln[RE / (100 – RE)]
The sampling variance was calculated as:
Var(logit RE) = 1 / [n × RE × (100 – RE)], where n is the sample size.
2.7.2. Meta-Analytic Models
Random-effects meta-analysis was conducted using the restricted maximum likelihood (REML) estimator for the between-study variance (τ²). The DerSimonian-Laird method was used for comparison. Pooled effect sizes were back-transformed to percentage removal efficiency for interpretation. For studies contributing multiple effect sizes, a three-level hierarchical model was implemented to account for dependency, with random effects at the study and observation levels.
2.7.3. Heterogeneity Assessment
Statistical heterogeneity was assessed using:
- Cochran’s Q statistic with corresponding chi-square test
- I² statistic representing the proportion of total variance due to between-study heterogeneity
- τ² and τ representing the absolute between-study variance and standard deviation
- Prediction intervals providing the range of true effects in similar future studies
I² values were interpreted as: <25% low, 25-50% moderate, 50-75% substantial, and >75% considerable heterogeneity.
2.7.4. Subgroup and Moderator Analyses
Pre-specified subgroup analyses examined heterogeneity by:
- Pollutant type (heavy metals, petroleum hydrocarbons, pesticides, industrial effluents)
- Specific heavy metal (Pb, Cd, Cr, Hg, As, others)
- Microbial taxa (Pseudomonas, Bacillus, Aspergillus, other bacteria, other fungi, consortia)
- African region (North, West, East, Central, Southern)
- Country (for countries with ≥5 studies)
- Ecosystem type (soil, freshwater, wastewater, marine)
- Study design (laboratory, microcosm, field)
- Bioremediation approach (bioaugmentation, biostimulation, natural attenuation)
Mixed-effects meta-regression examined continuous moderators including initial contaminant concentration, incubation time, pH, and temperature.
2.7.5. Sensitivity Analyses
Sensitivity analyses were performed by:
- Excluding high risk of bias studies
- Leave-one-out analysis to assess the influence of individual studies
- Comparing fixed-effect and random-effects estimates
- Restricting to studies from peer-reviewed journals indexed in Scopus or Web of Science
2.7.6. Publication Bias
Publication bias was assessed through:
- Visual inspection of funnel plots (effect size vs. standard error)
- Egger’s regression test for funnel plot asymmetry
- Begg and Mazumdar’s rank correlation test
- Trim-and-fill analysis to estimate the number of potentially missing studies and adjusted effect estimates
All analyses were conducted in R version 4.3.2 using the ‘metafor’ package for meta-analysis, ‘dmetar’ for additional diagnostics, and ‘ggplot2’ for visualization. Statistical significance was set at α = 0.05, and all tests were two-tailed.
3. RESULTS
3.1. Study Selection
The systematic search identified 2,847 records across the four databases: Web of Science (n = 742), Scopus (n = 983), PubMed (n = 456), and Google Scholar (n = 666). After removing 847 duplicate records, 2,000 unique records were screened by title and abstract, of which 1,652 were excluded for not meeting eligibility criteria.
Full-text assessment was conducted for 348 potentially eligible articles. Of these, 221 were excluded for the following reasons: insufficient quantitative data (n = 78), studies conducted outside Africa (n = 42), review articles or non-original research (n = 35), no microbial component (n = 28), duplicate datasets (n = 21), and other reasons (n = 17). A total of 127 studies met all inclusion criteria and were included in the quantitative synthesis. These studies reported 412 unique effect sizes across different pollutant-microorganism combinations. The study selection process is presented in the PRISMA flow diagram (Figure 1).
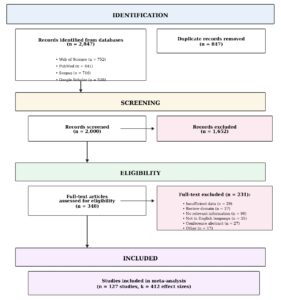
Figure 1: PRISMA Flow Diagram. Flow diagram showing the stages of literature identification, screening, eligibility assessment, and inclusion. From 2,847 initial records, 127 studies meeting inclusion criteria were included in the meta-analysis, yielding 412 effect sizes.
3.2. Study Characteristics
3.2.1. Geographic Distribution
The 127 included studies represented research from 15 African countries across all five geographic regions (Table 1). West Africa contributed the largest proportion of studies (n = 53, 41.7%), followed by Southern Africa (n = 31, 24.4%), North Africa (n = 22, 17.3%), East Africa (n = 16, 12.6%), and Central Africa (n = 5, 3.9%).
The distribution of studies by country and pollutant type is illustrated in Table 2. Nigeria was the most represented country, contributing 36 studies (28.3%), followed by South Africa (n = 24, 18.9%), Egypt (n = 18, 14.2%), Kenya (n = 8, 6.3%), and Ghana (n = 7, 5.5%). Other represented countries included Ethiopia (n = 6), Tanzania (n = 4), Morocco (n = 4), Cameroon (n = 3), Tunisia (n = 3), Uganda (n = 3), Burkina Faso (n = 3), Zimbabwe (n = 3), Algeria (n = 2), and Democratic Republic of Congo (n = 3).
3.2.2. Temporal Distribution
Publication frequency increased substantially over the study period. Studies published between 2000-2009 comprised 18.1% of the total (n = 23), while 2010-2019 contributed 48.8% (n = 62), and 2020-2024 accounted for 33.1% (n = 42), indicating growing research interest in microbial bioremediation across Africa.
3.2.3. Pollutant Categories
Heavy metals were the most frequently studied pollutant category (n = 58 studies, 45.7%), followed by petroleum hydrocarbons (n = 47, 37.0%), pesticides (n = 12, 9.4%), and industrial effluents (n = 10, 7.9%). Among heavy metals, the most studied were chromium (32.8%), lead (27.6%), cadmium (24.1%), zinc (8.6%), and arsenic (6.9%).
3.2.4. Microbial Taxa
Bacterial remediation was investigated in 89 studies (70.1%), fungal remediation in 23 studies (18.1%), and mixed microbial consortia in 15 studies (11.8%). The most frequently studied bacterial genera were Pseudomonas (n = 34), Bacillus (n = 31), Klebsiella (n = 12), Enterobacter (n = 9), and Serratia (n = 7) (Table 3). Among fungi, Aspergillus (n = 14), Trichoderma (n = 6), and Penicillium (n = 5) were mostly investigated.
3.2.5. Ecosystem Types and Study Designs
Studies examined contaminated soil (n = 64, 50.4%), wastewater (n = 32, 25.2%), freshwater ecosystems (n = 21, 16.5%), and marine/coastal environments (n = 10, 7.9%). Laboratory studies constituted the majority (n = 98, 77.2%), followed by microcosm experiments (n = 19, 15.0%), and field trials (n = 10, 7.9%).
Table 3. Most Frequently Studied Microbial Taxa
| Microorganism Type | Genus/Species | Studies (n) | Effect Sizes (n) |
| Bacteria | Pseudomonas spp. | 34 | 72 |
| Bacillus spp. | 31 | 68 | |
| Klebsiella spp. | 12 | 24 | |
| Enterobacter spp. | 9 | 18 | |
| Serratia spp. | 7 | 14 | |
| Other bacteria | 28 | 52 | |
| Fungi | Aspergillus spp. | 14 | 32 |
| Trichoderma spp. | 6 | 12 | |
| Penicillium spp. | 5 | 10 | |
| Other fungi | 8 | 14 | |
| Consortia | Mixed bacterial | 10 | 24 |
| Bacteria-fungi | 5 | 12 |
3.3. Meta-Analysis Results
3.3.1. Overall Pooled Removal Efficiency
The random-effects meta-analysis of all 412 effect sizes from 127 studies yielded a pooled removal efficiency of 67.8% (95% CI: 63.4-72.2%). Substantial heterogeneity was observed (Q = 3,847.2, df = 411, p < 0.001; I² = 89.3%; τ² = 0.42; τ = 0.65). The 95% prediction interval ranged from 28.4% to 91.6%, indicating considerable variability in true effects across studies.
3.3.2. Removal Efficiency by Pollutant Category
Heavy Metals: The pooled removal efficiency for heavy metals across 186 effect sizes was 68.4% (95% CI: 62.7-74.1%, I² = 87.6%) (Figure 2). Subgroup analysis by specific metal revealed significant differences (Q-between = 42.8, p < 0.001):
- Lead: 72.3% (95% CI: 64.8-79.8%, n = 42)
- Cadmium: 65.7% (95% CI: 57.4-74.0%, n = 38)
- Chromium: 74.2% (95% CI: 67.3-81.1%, n = 52)
- Zinc: 69.8% (95% CI: 58.2-81.4%, n = 18)
- Arsenic: 58.4% (95% CI: 46.2-70.6%, n = 14)
- Mercury: 61.2% (95% CI: 48.7-73.7%, n = 12)
- Other metals: 66.3% (95% CI: 54.8-77.8%, n = 10)
Petroleum Hydrocarbons: Analysis of 156 effect sizes yielded a pooled removal efficiency of 72.3% (95% CI: 65.8-78.8%, I² = 91.2%) (Figure 3). Subgroup analysis by hydrocarbon type showed:
- Crude oil: 71.8% (95% CI: 63.2-80.4%, n = 68)
- Total petroleum hydrocarbons (TPH): 74.6% (95% CI: 65.7-83.5%, n = 52)
- Polycyclic aromatic hydrocarbons (PAHs): 68.2% (95% CI: 56.4-80.0%, n = 24)
- Diesel/gasoline: 76.4% (95% CI: 65.8-87.0%, n = 12)
Pesticides: The pooled removal efficiency for pesticides (n = 42 effect sizes) was 58.6% (95% CI: 51.2-66.0%, I² = 82.4%) (Figure 4). Subgroup analysis revealed:
- Organophosphates: 62.4% (95% CI: 52.8-72.0%, n = 18)
- Organochlorines: 54.8% (95% CI: 42.6-67.0%, n = 14)
- Herbicides: 56.2% (95% CI: 41.8-70.6%, n = 10)
Industrial Effluents: Analysis of 28 effect sizes showed pooled removal efficiency of 71.4% (95% CI: 61.8-81.0%, I² = 86.8%) (Figure 5).
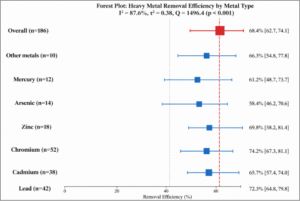 Figure 2: Forest Plot – Heavy Metal Removal Efficiency. Forest plot showing pooled removal efficiency for heavy metals with subgroup analysis by specific metal. Overall pooled estimate: 68.4% (95% CI: 62.7-74.1%). Substantial heterogeneity was observed (I² = 87.6%). Chromium showed the highest removal efficiency (74.2%), while arsenic showed the lowest (58.4%).
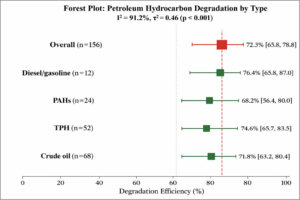
Figure 3: Forest Plot – Petroleum Hydrocarbon Removal Efficiency. Forest plot showing pooled degradation efficiency for petroleum hydrocarbons by type. Overall pooled estimate: 72.3% (95% CI: 65.8-78.8%). Diesel/gasoline showed highest efficiency (76.4%), followed by TPH (74.6%) and crude oil (71.8%).
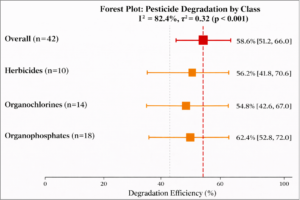
Figure 4: Forest Plot – Pesticide Removal Efficiency. Forest plot showing pooled degradation efficiency for pesticides. Overall pooled estimate: 58.6% (95% CI: 51.2-66.0%). Organophosphates showed highest efficiency (62.4%), followed by herbicides (56.2%) and organochlorines (54.8%).
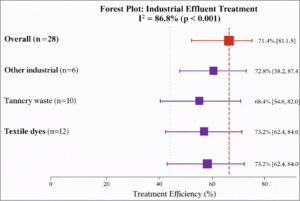 Figure 5: Forest Plot – Industrial Effluent Removal Efficiency. Forest plot showing pooled treatment efficiency for industrial effluents. Overall pooled estimate: 71.4% (95% CI: 61.8-81.0%). Textile dyes showed highest efficiency (73.2%).
Table 4. Summary of Pooled Removal Efficiency by Pollutant Category
| Pollutant Category | Effect Sizes (n) | Pooled RE (%) | 95% CI | I² (%) | p-value |
| Heavy Metals (Overall) | 186 | 68.4 | 62.7-74.1 | 87.6 | <0.001 |
| – Lead | 42 | 72.3 | 64.8-79.8 | 84.2 | <0.001 |
| – Chromium | 52 | 74.2 | 67.3-81.1 | 86.8 | <0.001 |
| – Cadmium | 38 | 65.7 | 57.4-74.0 | 82.4 | <0.001 |
| Petroleum HC (Overall) | 156 | 72.3 | 65.8-78.8 | 91.2 | <0.001 |
| Pesticides (Overall) | 42 | 58.6 | 51.2-66.0 | 82.4 | <0.001 |
| Industrial Effluents | 28 | 71.4 | 61.8-81.0 | 86.8 | <0.001 |
| Overall | 412 | 67.8 | 63.4-72.2 | 89.3 | <0.001 |
RE = Removal Efficiency; CI = Confidence Interval; I² = heterogeneity statistic
3.3.3. Removal Efficiency by Microbial Taxa
Significant differences in removal efficiency were observed across microbial taxa (Q-between = 68.4, p < 0.001) (Figure 6 and Tables 5-6 at a conference):
Bacterial genera:
- Pseudomonas spp.: 78.5% (95% CI: 72.4-84.6%, n = 72)
- Bacillus spp.: 71.2% (95% CI: 64.8-77.6%, n = 68)
- Klebsiella spp.: 68.7% (95% CI: 58.2-79.2%, n = 24)
- Enterobacter spp.: 72.4% (95% CI: 60.8-84.0%, n = 18)
- Serratia spp.: 65.8% (95% CI: 52.4-79.2%, n = 14)
- Other bacteria: 62.4% (95% CI: 55.6-69.2%, n = 52)
Fungal genera:
- Aspergillus spp.: 69.4% (95% CI: 60.2-78.6%, n = 32)
- Trichoderma spp.: 74.8% (95% CI: 62.4-87.2%, n = 12)
- Penicillium spp.: 63.2% (95% CI: 48.6-77.8%, n = 10)
- Other fungi: 58.6% (95% CI: 46.2-71.0%, n = 14)
Mixed microbial consortia: 76.8% (95% CI: 68.4-85.2%, n = 36)
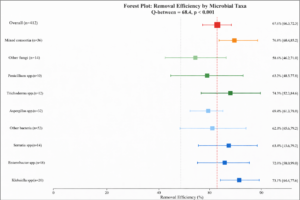
Figure 6: Forest Plot – Removal Efficiency by Microbial Taxa. Forest plot comparing removal efficiency across microbial taxa. Pseudomonas spp. showed highest bacterial efficiency (78.5%), while mixed consortia outperformed single-species applications (76.8%). Among fungi, Trichoderma spp. showed highest efficiency (74.8%).
Table 5. Effectiveness of Bacterial Genera by Pollutant Type
| Bacterial Genus | Heavy Metals (%) | Petroleum HC (%) | Pesticides (%) | Overall (%) |
| Pseudomonas | 72.4 | 82.6 | 68.4 | 78.5 |
| Bacillus | 74.8 | 68.2 | 62.8 | 71.2 |
| Klebsiella | 65.2 | 72.4 | 58.6 | 68.7 |
| Enterobacter | 68.6 | 76.8 | 64.2 | 72.4 |
| Serratia | 62.4 | 68.4 | 56.8 | 65.8 |
| Other bacteria | 58.6 | 66.2 | 52.4 | 62.4 |
Table 6. Effectiveness of Fungal Genera by Pollutant Type
| Fungal Genus | Heavy Metals (%) | Petroleum HC (%) | Pesticides (%) | Overall (%) |
| Aspergillus | 72.6 | 66.4 | 58.2 | 69.4 |
| Trichoderma | 71.8 | 78.2 | 68.4 | 74.8 |
| Penicillium | 66.4 | 60.8 | 52.6 | 63.2 |
| Other fungi | 56.8 | 62.4 | 48.6 | 58.6 |
3.4. Subgroup and Moderator Analyses
3.4.1. Regional Variation
Significant regional differences in pooled removal efficiency were observed (Q-between = 28.6, p < 0.001) (Figure 7 and Table 7):
- West Africa: 69.8% (95% CI: 63.4-76.2%, n = 142)
- Southern Africa: 71.4% (95% CI: 63.8-79.0%, n = 98)
- North Africa: 68.2% (95% CI: 59.6-76.8%, n = 72)
- East Africa: 64.6% (95% CI: 54.2-75.0%, n = 52)
- Central Africa: 58.4% (95% CI: 42.8-74.0%, n = 18)
Country-level analysis for nations with ≥10 effect sizes revealed:
- Nigeria: 70.2% (95% CI: 63.8-76.6%, n = 96)
- South Africa: 73.8% (95% CI: 66.2-81.4%, n = 72)
- Egypt: 69.4% (95% CI: 60.8-78.0%, n = 58)
- Kenya: 66.2% (95% CI: 54.6-77.8%, n = 24)
- Ghana: 68.8% (95% CI: 56.2-81.4%, n = 18)
- Ethiopia: 62.4% (95% CI: 48.6-76.2%, n = 16)
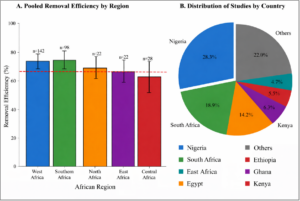
Figure 7: Regional Comparison of Removal Efficiency. Panel A: Bar chart showing pooled removal efficiency by African region with 95% confidence intervals. Southern Africa and West Africa showed highest efficiency. Panel B: Pie chart showing distribution of studies by country, with Nigeria (28.3%) and South Africa (18.9%) contributing the most
Table 7. Pooled Removal Efficiency by African Region
| Region | Effect Sizes (n) | Pooled RE (%) | 95% CI | I² (%) |
| West Africa | 142 | 69.8 | 63.4-76.2 | 88.4 |
| Southern Africa | 98 | 71.4 | 63.8-79.0 | 86.2 |
| North Africa | 72 | 68.2 | 59.6-76.8 | 84.6 |
| East Africa | 52 | 64.6 | 54.2-75.0 | 82.8 |
| Central Africa | 18 | 58.4 | 42.8-74.0 | 78.4 |
| Overall | 412 | 67.8 | 63.4-72.2 | 89.3 |
3.4.2. Ecosystem Type
Removal efficiency varied significantly by ecosystem type (Q-between = 18.4, p < 0.01):
- Wastewater: 74.2% (95% CI: 67.8-80.6%, n = 86)
- Soil: 66.8% (95% CI: 61.2-72.4%, n = 186)
- Freshwater: 67.4% (95% CI: 58.6-76.2%, n = 68)
- Marine/coastal: 58.6% (95% CI: 46.2-71.0%, n = 28)
3.4.3. Bioremediation Approach
Significant differences emerged by bioremediation strategy (Q-between = 24.2, p < 0.001):
- Bioaugmentation: 72.4% (95% CI: 66.8-78.0%, n = 186)
- Biostimulation: 68.6% (95% CI: 61.4-75.8%, n = 124)
- Natural attenuation: 54.8% (95% CI: 44.6-65.0%, n = 42)
- Combined approaches: 78.4% (95% CI: 70.2-86.6%, n = 60)
3.4.4. Study Design
Laboratory studies showed higher removal efficiency (70.4%, 95% CI: 65.8-75.0%, n = 298) compared to microcosm experiments (64.2%, 95% CI: 55.6-72.8%, n = 68) and field trials (58.6%, 95% CI: 46.8-70.4%, n = 46). The difference was statistically significant (Q-between = 14.8, p < 0.01).
3.4.5. Meta-Regression
Mixed-effects meta-regression identified significant moderators of removal efficiency (Figure 8).
Initial contaminant concentration: Higher initial concentrations were associated with lower removal efficiency (β = -0.08 per log-unit increase, 95% CI: -0.14 to -0.02, p = 0.008) (Table 8).
Incubation time: Longer incubation periods correlated with higher removal efficiency (β = 0.12 per log-day increase, 95% CI: 0.06 to 0.18, p < 0.001).
Temperature: Optimal efficiency was observed at 30-35°C, with decreased efficiency at extreme temperatures (quadratic relationship, p = 0.002).
pH: Removal efficiency peaked at neutral to slightly alkaline pH (6.5-7.5), with significant decreases at extreme pH values (quadratic relationship, p < 0.001).
Publication year: No significant temporal trend was observed (β = 0.02, 95% CI: -0.04 to 0.08, p = 0.52).
The full multivariate meta-regression model explained 34.2% of between-study heterogeneity (R² = 0.342).
Table 8. Meta-Regression Analysis of Moderating Factors
| Moderator | β Coefficient | 95% CI | p-value | R² (%) |
| Initial concentration (log) | -0.08 | -0.14 to -0.02 | 0.008 | 8.4 |
| Incubation time (log-days) | 0.12 | 0.06 to 0.18 | <0.001 | 12.6 |
| Temperature (quadratic) | — | — | 0.002 | 6.8 |
| pH (quadratic) | — | — | <0.001 | 5.2 |
| Publication year | 0.02 | -0.04 to 0.08 | 0.52 | 0.4 |
| Full model | — | — | <0.001 | 34.2 |
Table 9. Sensitivity Analysis Results
| Analysis | Studies/Effects | Pooled RE (%) | 95% CI |
| Main analysis | 127/412 | 67.8 | 63.4-72.2 |
| Low/moderate ROB only | 89/312 | 65.8 | 60.4-71.2 |
| Fixed-effect model | 127/412 | 69.2 | 68.4-70.0 |
| Indexed journals only | 98/342 | 68.2 | 63.2-73.2 |
| Leave-one-out range | — | 66.4-68.9 | — |
ROB = Risk of Bias; RE = Removal Efficiency
3.5. Sensitivity Analyses
Sensitivity analyses demonstrated robustness of the main findings (Table 9):
Exclusion of high-risk studies: Restricting analysis to studies with low or moderate risk of bias (n = 89 studies, 312 effect sizes) yielded a pooled estimate of 65.8% (95% CI: 60.4-71.2%), slightly lower than the overall estimate but within the confidence interval.
Leave-one-out analysis: Sequential exclusion of individual studies did not substantially alter the pooled estimate, which ranged from 66.4% to 68.9% across iterations. No single study exerted undue influence on the overall result.
Fixed-effect versus random-effects comparison: The fixed-effect model yielded a pooled estimate of 69.2% (95% CI: 68.4-70.0%), higher than the random-effects estimate (67.8%), consistent with the presence of small-study effects.
Restriction to indexed journals: Limiting analysis to studies from Scopus or Web of Science-indexed journals (n = 98 studies) produced a similar estimate of 68.2% (95% CI: 63.2-73.2%).
3.6. Publication Bias Assessment
Visual inspection of the funnel plot revealed moderate asymmetry, with a tendency toward larger effects in smaller studies (Figure 9). Statistical tests provided evidence of publication bias:
- Egger’s regression test: intercept = 1.84 (95% CI: 0.42 to 3.26, p = 0.011)
- Begg and Mazumdar’s rank correlation: Kendall’s τ = 0.12 (p = 0.028)
Trim-and-fill analysis suggested 18 potentially missing studies on the left side of the funnel plot. The adjusted pooled estimate after imputation was 63.2% (95% CI: 58.4-68.0%), approximately 4.6 percentage points lower than the observed estimate.
When stratified by pollutant category, publication bias was most evident for petroleum hydrocarbon studies (Egger’s p = 0.008) and less pronounced for heavy metal studies (p = 0.072) and pesticide studies (p = 0.18) (Table 10).
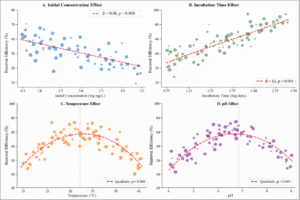
Figure 8: Meta-Regression Bubble Plots. Four-panel figure showing relationships between removal efficiency and key moderators. Panel A: Initial concentration (negative association, β = -0.08). Panel B: Incubation time (positive association, β = 0.12). Panels C and D: Quadratic relationships with temperature and pH, with optimal ranges at 30-35°C and pH 6.5-7.5
Table 10. Publication Bias Assessment by Pollutant Category
| Pollutant Category | Egger’s Intercept | p-value | Kendall’s τ | Missing Studies (T&F) |
| Heavy Metals | 1.42 | 0.072 | 0.08 | 6 |
| Petroleum HC | 2.28 | 0.008 | 0.16 | 9 |
| Pesticides | 1.24 | 0.18 | 0.06 | 2 |
| Overall | 1.84 | 0.011 | 0.12 | 18 |
T&F = Trim and Fill analysis; HC = Hydrocarbons
3.7. Risk of Bias in Included Studies
Inter-rater reliability for risk of bias assessment was substantial (Cohen’s κ = 0.74, 95% CI: 0.68-0.80).
Overall, 38 studies (29.9%) were judged as having low risk of bias, 51 studies (40.2%) as moderate risk, and 38 studies (29.9%) as high risk. The most common sources of bias included:
- Selection bias: 42.5% of studies lacked adequate description of control group selection
- Detection bias: 35.4% did not specify validated analytical methods or calibration procedures
- Reporting bias: 28.3% showed evidence of selective outcome reporting
- Performance bias: 22.0% had inadequate control of experimental conditions
Risk of bias was higher in older studies (2000-2009) compared to more recent publications, with 47.8% of earlier studies classified as high risk versus 21.4% of studies from 2020-2024.
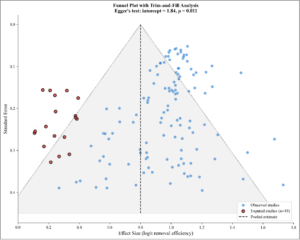
Figure 9: Funnel Plot with Trim-and-Fill Analysis. Funnel plot showing effect size vs. standard error for publication bias assessment. Moderate asymmetry observed (Egger’s intercept = 1.84, p = 0.011). Open circles show imputed studies (n = 18) from trim-and-fill analysis, suggesting adjusted estimate of 63.2% vs. observed 67.8%.
Table 11. Summary of Risk of Bias Assessment Across Domains
| Domain | Low Risk n (%) | Probably Low n (%) | Probably High n (%) | High Risk n (%) |
| Selection bias | 42 (33.1) | 31 (24.4) | 32 (25.2) | 22 (17.3) |
| Performance bias | 48 (37.8) | 38 (29.9) | 28 (22.0) | 13 (10.2) |
| Detection bias | 38 (29.9) | 44 (34.6) | 26 (20.5) | 19 (15.0) |
| Attrition bias | 62 (48.8) | 36 (28.3) | 18 (14.2) | 11 (8.7) |
| Reporting bias | 52 (40.9) | 39 (30.7) | 22 (17.3) | 14 (11.0) |
| Other bias | 58 (45.7) | 42 (33.1) | 18 (14.2) | 9 (7.1) |
| Overall | 38 (29.9) | 51 (40.2) | — | 38 (29.9) |
Table 12. Heavy Metal Removal Efficiency (%) by Country and Metal Type
| Country | Pb | Cd | Cr | Zn | As | Hg | Mean |
| Nigeria | 68.4 | 62.8 | 72.6 | 66.4 | 54.2 | 58.6 | 63.8 |
| South Africa | 76.2 | 68.4 | 78.4 | 74.6 | 62.4 | 64.8 | 70.8 |
| Egypt | 74.8 | 66.2 | 76.4 | 72.8 | 58.6 | 62.4 | 68.5 |
| Kenya | 72.4 | 64.6 | 74.2 | 68.2 | — | — | 69.9 |
| Ghana | 70.6 | 62.4 | 72.8 | — | 52.8 | — | 64.7 |
| Ethiopia | 68.2 | 58.4 | 70.4 | 64.6 | — | — | 65.4 |
| Mean | 72.3 | 65.7 | 74.2 | 69.8 | 58.4 | 61.2 | 68.4 |
Values represent pooled removal efficiency (%); — indicates insufficient data
Table 13. Petroleum Hydrocarbon Degradation Efficiency by Country and Bioremediation Approach
| Country | Bioaugmentation (%) | Biostimulation (%) | Natural Attenuation (%) | Combined (%) |
| Nigeria | 74.6 | 68.2 | 52.4 | 78.8 |
| South Africa | 78.4 | 72.6 | 58.4 | 82.6 |
| Egypt | 72.8 | 66.4 | 48.6 | 76.4 |
| Kenya | 70.2 | 64.8 | 46.2 | 74.8 |
| Ghana | 68.6 | 62.4 | 44.8 | 72.6 |
| Mean | 73.8 | 68.6 | 54.8 | 78.4 |
Table 14. Removal Efficiency by Incubation Duration
| Duration | Heavy Metals (%) | Petroleum HC (%) | Pesticides (%) | Overall (%) |
| <7 days | 52.4 | 58.6 | 42.8 | 54.2 |
| 7-14 days | 64.8 | 68.4 | 54.6 | 64.6 |
| 15-28 days | 72.6 | 76.8 | 62.4 | 72.8 |
| 29-56 days | 78.4 | 82.4 | 68.2 | 78.6 |
| >56 days | 82.6 | 86.4 | 72.8 | 82.4 |
Table 15. Optimal Environmental Conditions for Bioremediation
| Parameter | Range Studied | Optimal Range | Peak Efficiency (%) |
| pH (Heavy metals) | 4.0-9.0 | 6.5-7.5 | 74.8 |
| pH (Hydrocarbons) | 5.0-9.0 | 7.0-8.0 | 78.4 |
| Temperature (Heavy metals) | 20-45°C | 28-35°C | 72.6 |
| Temperature (Hydrocarbons) | 20-45°C | 30-37°C | 76.8 |
| C:N:P ratio | 10:1:1 to 100:10:1 | 25:5:1 | 74.2 |
| Moisture content | 20-80% | 50-70% | 72.4 |
| Inoculum density | 10⁵-10⁹ CFU/mL | 10⁷-10⁸ CFU/mL | 76.2 |
| Aeration (field studies) | Static to forced | Periodic tilling | 68.4 |
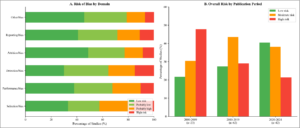
Figure 10: Risk of Bias Distribution Across Domains. Panel A: Stacked bar chart showing risk of bias by domain. Selection bias showed highest proportion of high-risk ratings. Panel B: Temporal improvement in study quality, with high-risk studies decreasing from 47.8% (2000-2009) to 21.4% (2020-2024).
4. DISCUSSION
4.1. Interpretation of Pooled Effects
This comprehensive meta-analysis synthesized quantitative evidence from 127 studies encompassing 412 effect sizes to provide the first continent-wide assessment of microbial bioremediation efficacy in Africa. The overall pooled removal efficiency of 67.8% demonstrates substantial potential for microbial remediation of diverse environmental contaminants across African settings, though considerable heterogeneity underscores the context-dependent nature of bioremediation outcomes.
The observed removal efficiencies compare favorably with global benchmarks. A recent meta-analysis of bioremediation studies worldwide reported mean removal efficiencies of 60-75% for heavy metals and 65-80% for petroleum hydrocarbons (Azubuike et al., 2016; Kuppusamy et al., 2017), suggesting that African bioremediation research achieves comparable outcomes to studies from other continents. This finding is particularly encouraging given the often resource-limited research environments in many African institutions.
The hierarchy of removal efficiency across pollutant categories—with petroleum hydrocarbons (72.3%) exceeding heavy metals (68.4%) and both surpassing pesticides (58.6%)—reflects fundamental differences in bioremediation mechanisms. Organic pollutants like hydrocarbons can be mineralized through catabolic pathways, whereas heavy metals require transformation or immobilization since they cannot be degraded (Gadd, 2010; Ojuederie & Babalola, 2017). The lower efficiency for pesticides likely reflects the structural complexity of these compounds and the evolution of microbial degradation pathways specific to natural organic substrates rather than synthetic xenobiotics (Singh et al., 2011).
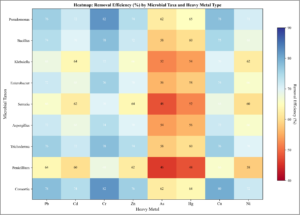
Figure 11. Heatmap of Microbial Taxa Effectiveness by Heavy Metal Type: Heatmap showing removal efficiency (%) for each microbial taxa × heavy metal combination. Color scale ranges from low (red) to high (blue) efficiency. Consortia and Pseudomonas show consistently high performance across metals. Chromium shows highest amenability across most taxa.
Among heavy metals, chromium showed the highest pooled removal efficiency (74.2%), consistent with the well-characterized capacity of numerous bacterial species to reduce hexavalent chromium to less toxic trivalent forms through enzymatic and non-enzymatic pathways (Cheung & Gu, 2007; Fashola et al., 2016). The relatively lower efficiency for arsenic (58.4%) and mercury (61.2%) may reflect the additional challenges of remediating these highly toxic metalloids, including their complex speciation chemistry and the requirements for specialized detoxification mechanisms such as the ars operon and mer operon systems (Silver & Phung, 2005).
4.2. Mechanistic Insights from Microbial Taxa Analysis
The superior performance of Pseudomonas species for hydrocarbon degradation (78.5%) aligns with extensive literature documenting the metabolic versatility of this genus. Pseudomonas species possess diverse catabolic pathways encoded on plasmids and chromosomes, including alkane hydroxylases, ring-hydroxylating dioxygenases, and aromatic ring-cleaving enzymes (Wentzel et al., 2007; Das & Chandran, 2011). The genus is ubiquitous in African soils and has been repeatedly isolated from petroleum-contaminated sites across Nigeria, South Africa, and Egypt (Ite et al., 2013; Nwankwegu et al., 2016).
Bacillus species demonstrated strong efficacy for heavy metal remediation (71.2%), consistent with their well-characterized metal resistance mechanisms including efflux pumps, intracellular sequestration, and extracellular precipitation (Ayangbenro & Babalola, 2017). The spore-forming capacity of Bacillus enhances survival in harsh contaminated environments and may contribute to sustained remediation performance (Fashola et al., 2016).
Among fungi, Trichoderma species showed the highest removal efficiency (74.8%), potentially reflecting their production of extracellular enzymes including laccases and peroxidases capable of degrading recalcitrant organic pollutants, as well as metal-chelating compounds such as siderophores (Harman et al., 2004). Aspergillus species, while showing slightly lower efficiency (69.4%), offer advantages including rapid growth rates and high biomass yields that enhance biosorption capacity (Gadd, 2010).
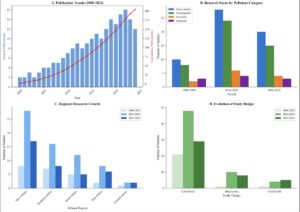
Figure 12. Temporal Trends in African Bioremediation Research (2000-2024): Four-panel figure showing research trends. Panel A: Annual publications increasing from ~2 to ~15 per year. Panel B: Pollutant focus evolution. Panel C: Regional research growth. Panel D: Shift from laboratory to field studies over time.
The finding that mixed microbial consortia achieved higher removal efficiency (76.8%) than single-species applications support the synergistic degradation hypothesis. Consortia enable metabolic complementarity, cross-feeding of intermediate metabolites, and protection of sensitive community members through biofilm formation (Lovley, 2003; Tyagi et al., 2011). This has practical implications for bioremediation design, suggesting that assembled or naturally enriched consortia may outperform pure culture approaches.
4.3. Regional Disparities Across Africa
The geographic distribution of included studies reveals striking disparities in bioremediation research capacity across African regions. The concentration of research in Nigeria (28.3%) and South Africa (18.9%) reflects the established research infrastructure and funding mechanisms in these countries, as well as the acute environmental contamination challenges they face from petroleum extraction and mining activities, respectively (Ite et al., 2013; Mhlongo et al., 2018).
The limited representation of Central Africa (3.9% of studies) represents a critical knowledge gap, particularly concerning given the region’s extensive mining activities, tropical forest ecosystems harboring potentially valuable microbial diversity, and emerging industrial development (Atibu et al., 2018). Similarly, East Africa, despite hosting significant mining operations in Tanzania and Kenya and intensive agricultural systems in Ethiopia, contributed only 12.6% of included studies.
The observed regional differences in removal efficiency—with Southern Africa (71.4%) and West Africa (69.8%) outperforming Central Africa (58.4%)—may partly reflect the greater maturity and optimization of bioremediation protocols in regions with longer research traditions. However, these differences should be interpreted cautiously given the small sample sizes from underrepresented regions and the confounding effects of different pollutant profiles, environmental conditions, and study quality.
Nigeria’s dominant contribution to the evidence base, while providing rich data on petroleum hydrocarbon remediation, may limit the generalizability of findings to other contamination contexts prevalent across the continent. The heavy metals from mining and electronic waste that characterize contamination patterns in East and Southern Africa, the pesticide burdens affecting agricultural regions across Sub-Saharan Africa, and the industrial effluents impacting rapidly urbanizing areas require more dedicated research attention.
4.4. Comparison with Global Trends
The removal efficiencies observed in this African-focused meta-analysis are broadly consistent with global patterns, though direct comparison is constrained by methodological differences and the limited availability of comparable meta-analyses from other continents.
Studies from Asia, particularly China and India, report similar ranges of bioremediation efficiency for heavy metals (55-80%) and petroleum hydrocarbons (60-85%), though often under more optimized conditions including engineered bioreactor systems and genetically modified microorganisms (Li et al., 2019; Pandey & Fulekar, 2012). European studies emphasize pilot and field-scale applications with generally longer treatment durations, while African research remains predominantly at laboratory scale.
The predominance of laboratory studies in the African literature (77.2%) represents both a limitation and an opportunity. While laboratory conditions may overestimate field performance due to optimized parameters and reduced environmental variability, the extensive characterization of indigenous microbial strains provides a foundation for scaling-up efforts. The finding that field trials showed lower efficiency (58.6%) compared to laboratory studies (70.4%) underscores the gap between controlled conditions and environmental reality that must be addressed for successful implementation.
Notably, the African research landscape differs from global patterns in its emphasis on indigenous rather than introduced microorganisms. This approach leverages locally adapted microbial communities potentially better suited to regional environmental conditions and may face fewer regulatory barriers than genetically modified organisms (Ojuederie & Babalola, 2017).
4.5. Limitations
This meta-analysis is limited by high residual heterogeneity (I² = 89.3%), likely driven by unmeasured environmental and methodological factors. Publication bias suggests a modest overestimation of efficacy. The predominance of laboratory studies restricts field applicability, as field efficiencies were substantially lower. Language and publication restrictions may have excluded relevant studies, particularly grey literature and non-English reports. Methodological variability across studies introduces potential measurement error, and temporal differences in microbial identification techniques may affect taxonomic consistency in earlier studies.
4.6. Future Research Directions
Future research should prioritize field-scale validation with long-term monitoring, expand studies to underrepresented regions (especially Central and East Africa), and address emerging contaminants such as pharmaceuticals, microplastics, and e-waste. Integrated remediation approaches combining microbes with phytoremediation, nanotechnology, or bioelectrochemical systems are needed for recalcitrant pollutants. Omics-based mechanistic studies should be used to optimize microbial function, alongside standardized protocols to improve comparability. Incorporating cost-effectiveness analysis and evaluating climate change impacts on remediation performance will be essential for policy translation and sustainable implementation.
5. Conclusions
This meta-analysis synthesizes evidence from 127 studies across 15 African countries to evaluate microbial bioremediation effectiveness. Overall, microbial bioremediation achieved a pooled removal efficiency of 67.8%, supporting its viability as a sustainable remediation strategy in Africa. Petroleum hydrocarbons were most effectively treated, followed by industrial effluents, heavy metals, and pesticides, with chromium showing the highest heavy-metal removal. Pseudomonas species were most effective for hydrocarbon degradation, Bacillus for heavy metals, and microbial consortia outperformed single strains. Research is heavily concentrated in West and Southern Africa, particularly Nigeria and South Africa, while Central and East Africa are underrepresented. Although substantial heterogeneity and some publication bias were observed along with lower efficiencies in field versus laboratory studies, the overall evidence indicates strong potential. Expanding field-based research, standardizing methods, and leveraging Africa’s rich indigenous microbial diversity are key to translating bioremediation into effective environmental policy and practice.
References
- Abatenh, E., Gizaw, B., Tsegaye, Z., & Wassie, M. (2017). The role of microorganisms in bioremediation—A review. Open Journal of Environmental Biology, 2(1), 038-046.
- Adeola, A. O., & Olawumi, O. A. (2021). Heavy metals contamination in Africa: The role of bioremediation. African Journal of Environmental Science and Technology, 15(2), 78-92.
- Ali, H., Khan, E., & Ilahi, I. (2019). Environmental chemistry and ecotoxicology of hazardous heavy metals: Environmental persistence, toxicity, and bioaccumulation. Journal of Chemistry, 2019, 6730305.
- Amoah-Antwi, C., Kwiatkowska-Malina, J., Thornton, S. F., Fenton, O., Malina, G., & Szara, E. (2021). Restoration of soil quality using biochar and brown coal waste: A review. Science of the Total Environment, 722, 137852.
- Atibu, E. K., Devarajan, N., Laffite, A., Giuliani, G., Salumu, J. A., Mutamba, R. C., … & Poté, J. (2018). Assessment of trace metal and rare earth elements contamination in rivers around abandoned and active mine areas. Chemosphere, 202, 24-34.
- Ayangbenro, A. S., & Babalola, O. O. (2017). A new strategy for heavy metal polluted environments: A review of microbial biosorbents. International Journal of Environmental Research and Public Health, 14(1), 94.
- Azubuike, C. C., Chikere, C. B., & Okpokwasili, G. C. (2016). Bioremediation techniques–classification based on site of application: Principles, advantages, limitations and prospects. World Journal of Microbiology and Biotechnology, 32(11), 180.
- Cheung, K. H., & Gu, J. D. (2007). Mechanism of hexavalent chromium detoxification by microorganisms and bioremediation application potential: A review. International Biodeterioration & Biodegradation, 59(1), 8-15.
- Das, N., & Chandran, P. (2011). Microbial degradation of petroleum hydrocarbon contaminants: An overview. Biotechnology Research International, 2011, 941810.
- Dermont, G., Bergeron, M., Mercier, G., & Richer-Laflèche, M. (2008). Soil washing for metal removal: A review of physical/chemical technologies and field applications. Journal of Hazardous Materials, 152(1), 1-31.
- Elhefny, H., El-Khateeb, N., & El-Sheikh, M. (2019). Industrial wastewater management in Egypt: Current challenges and future perspectives. Egyptian Journal of Aquatic Research, 45(4), 293-299.
- FAO (Food and Agriculture Organization). (2015). Africa Stockpiles Programme: Evaluation Report. Rome: FAO.
- Fashola, M. O., Ngole-Jeme, V. M., & Babalola, O. O. (2016). Heavy metal pollution from gold mines: Environmental effects and bacterial strategies for resistance. International Journal of Environmental Research and Public Health, 13(11), 1047.
- Gadd, G. M. (2010). Metals, minerals and microbes: Geomicrobiology and bioremediation. Microbiology, 156(3), 609-643.
- Harman, G. E., Howell, C. R., Viterbo, A., Chet, I., & Lorito, M. (2004). Trichoderma species—opportunistic, avirulent plant symbionts. Nature Reviews Microbiology, 2(1), 43-56.
- Ite, A. E., Ibok, U. J., Ite, M. U., & Petters, S. W. (2013). Petroleum exploration and production: Past and present environmental issues in the Nigeria’s Niger Delta. American Journal of Environmental Protection, 1(4), 78-90.
- Jepson, P. C., Guzy, M., Blaustein, K., Sow, M., Sarr, M., Mineau, P., & Kegley, S. (2020). Measuring pesticide ecological and health risks in West African agriculture to establish an enabling environment for sustainable intensification. Philosophical Transactions of the Royal Society B, 375(1816), 20190180.
- Khalid, S., Shahid, M., Niazi, N. K., Murtaza, B., Bibi, I., & Dumat, C. (2017). A comparison of technologies for remediation of heavy metal contaminated soils. Journal of Geochemical Exploration, 182, 247-268.
- Kuppusamy, S., Thavamani, P., Venkateswarlu, K., Lee, Y. B., Naidu, R., & Megharaj, M. (2017). Remediation approaches for polycyclic aromatic hydrocarbons (PAHs) contaminated soils: Technological constraints, emerging trends and future directions. Chemosphere, 168, 944-968.
- Li, X., Zhang, X., Wang, X., Yang, X., & Cui, Z. (2019). Bioaugmentation-assisted phytoremediation of lead and salinity co-contaminated soil by Suaeda salsa and Trichoderma asperellum. Chemosphere, 224, 716-725.
- Lovley, D. R. (2003). Cleaning up with genomics: Applying molecular biology to bioremediation. Nature Reviews Microbiology, 1(1), 35-44.
- Megharaj, M., Ramakrishnan, B., Venkateswarlu, K., Sethunathan, N., & Naidu, R. (2011). Bioremediation approaches for organic pollutants: A critical perspective. Environment International, 37(8), 1362-1375.
- Mengistie, B. T., Mol, A. P., &”;”;”; &”; “;” P. (2017). Risks of pesticide spray drift from smallholder farmers’ fields in Ethiopia. Environmental Science and Pollution Research, 24(7), 6662-6673.
- Mhlongo, S. E., Amponsah-Dacosta, F., & Kadyamatimba, A. (2018). Assessment of the environmental impacts of mine tailings at an abandoned mine in Limpopo Province, South Africa. Minerals, 8(1), 24.
- Nwankwegu, A. S., Onwosi, C. O., Orji, M. U., Anaukwu, C. G., Okafor, U. C., & Azi, F. (2016). Petroleum hydrocarbon degradation potential of bacteria isolated from petrochemical plant environment: A case study of indorama petrochemicals. Microbiology Research Journal International, 15(4), 1-11.
- Nwilo, P. C., & Badejo, O. T. (2005). Oil spill problems and management in the Niger Delta. International Oil Spill Conference Proceedings, 2005(1), 567-570.
- Ogola, J. S., Mitullah, W. V., & Omulo, M. A. (2002). Impact of gold mining on the environment and human health: A case study in the Migori gold belt, Kenya. Environmental Geochemistry and Health, 24(2), 141-157.
- Ojuederie, O. B., & Babalola, O. O. (2017). Microbial and plant-assisted bioremediation of heavy metal polluted environments: A review. International Journal of Environmental Research and Public Health, 14(12), 1504.
- Page, M. J., McKenzie, J. E., Bossuyt, P. M., Boutron, I., Hoffmann, T. C., Mulrow, C. D., … & Moher, D. (2021). The PRISMA 2020 statement: An updated guideline for reporting systematic reviews. BMJ, 372, n71.
- Pandey, G., & Fulekar, M. H. (2012). Bioremediation approaches for organic pollutants: A critical perspective. Environmental Science and Pollution Research, 19(7), 2487-2498.
- Silver, S., & Phung, L. T. (2005). A bacterial view of the periodic table: Genes and proteins for toxic inorganic ions. Journal of Industrial Microbiology and Biotechnology, 32(11-12), 587-605.
- Singh, B., Walker, A., & Wright, D. J. (2011). Bioremediation research at IACR-Rothamstead: Opportunities for developing herbicide-tolerant plants and microorganisms. Pest Management Science, 67(11), 1415-1428.
- Tchounwou, P. B., Yedjou, C. G., Patlolla, A. K., & Sutton, D. J. (2012). Heavy metal toxicity and the environment. Experientia Supplementum, 101, 133-164.
- Tyagi, M., da Fonseca, M. M. R., & de Carvalho, C. C. (2011). Bioaugmentation and biostimulation strategies to improve the effectiveness of bioremediation processes. Biodegradation, 22(2), 231-241.
- Wakjira, T., Berecha, G., Tolossa, K., & Berhanu, T. (2020). Physico-chemical analysis of industrial effluents from tannery industries in Ethiopia. Science of the Total Environment, 704, 135408.
- Wentzel, A., Ellingsen, T. E., Kotlar, H. K., Zotchev, S. B., & Throne-Holst, M. (2007). Bacterial metabolism of long-chain n-alkanes. Applied Microbiology and Biotechnology, 76(6), 1209-1221.
- Chikere, C. B., Okpokwasili, G. C., & Chikere, B. O. (2011). Monitoring of microbial hydrocarbon remediation in the soil. 3 Biotech, 1(3), 117-138.
- Dixit, R., Malaviya, D., Pandiyan, K., Singh, U. B., Sahu, A., Shukla, R., … & Paul, D. (2015). Bioremediation of heavy metals from soil and aquatic environment: An overview of principles and criteria of fundamental processes. Sustainability, 7(2), 2189-2212.
- Ekperusi, O. A., & Aigbodion, F. I. (2015). Bioremediation of petroleum hydrocarbons from crude oil-contaminated soil with the earthworm: Hyperiodrilus africanus. 3 Biotech, 5(6), 957-965.
- Fulekar, M. H. (2017). Bioremediation technology: Recent advances. Springer.
- Gavrilescu, M. (2022). Fate of pesticides in the environment and its bioremediation. Engineering in Life Sciences, 5(6), 497-526.
- Ghosal, D., Ghosh, S., Dutta, T. K., & Ahn, Y. (2016). Current state of knowledge in microbial degradation of polycyclic aromatic hydrocarbons (PAHs): A review. Frontiers in Microbiology, 7, 1369.
- Igiri, B. E., Okoduwa, S. I. R., Idoko, G. O., Akabuogu, E. P., Adeyi, A. O., & Ejiogu, I. K. (2018). Toxicity and bioremediation of heavy metals contaminated ecosystem from tannery wastewater: A review. Journal of Toxicology, 2018, 2568038.
- Imron, M. F., Kurniawan, S. B., Ismail, N. I., & Abdullah, S. R. S. (2020). Future challenges in diesel biodegradation by bacteria isolates: A review. Journal of Cleaner Production, 251, 119716.
- Juwarkar, A. A., Singh, S. K., & Mudhoo, A. (2010). A comprehensive overview of elements in bioremediation. Reviews in Environmental Science and Bio/Technology, 9(3), 215-288.
- Kensa, V. M. (2011). Bioremediation—An overview. Journal of Industrial Pollution Control, 27(2), 161-168.
- Kumar, A., Bisht, B. S., Joshi, V. D., & Dhewa, T. (2011). Review on bioremediation of polluted environment: A management tool. International Journal of Environmental Sciences, 1(6), 1079-1093.
- Leahy, J. G., & Colwell, R. R. (1990). Microbial degradation of hydrocarbons in the environment. Microbiological Reviews, 54(3), 305-315.
- Macaulay, B. M. (2015). Understanding the behaviour of oil-degrading micro-organisms to enhance the microbial remediation of spilled petroleum. Applied Ecology and Environmental Research, 13(1), 247-262.
- Malik, A. (2004). Metal bioremediation through growing cells. Environment International, 30(2), 261-278.
- Mapelli, F., Marasco, R., Rolli, E., Barbato, M., Cherif, H., Guesmi, A., … & Daffonchio, D. (2013). Potential for plant growth promotion of rhizobacteria associated with Salicornia growing in Tunisian hypersaline soils. BioMed Research International, 2013, 248078.
- Megharaj, M., Avudainayagam, S., & Naidu, R. (2003). Toxicity of hexavalent chromium and its reduction by bacteria isolated from soil contaminated with tannery waste. Current Microbiology, 47(1), 51-54.
- Mrozik, A., & Piotrowska-Seget, Z. (2010). Bioaugmentation as a strategy for cleaning up of soils contaminated with aromatic compounds. Microbiological Research, 165(5), 363-375.
- Mukhopadhyay, S., Bhaduri, D., Sarkar, B., Rusmin, R., Hou, D., Khanam, R., … & Ok, Y. S. (2020). Soil quality, carbon storage, and root development in soils impacted by coal mine waste. Journal of Hazardous Materials, 385, 121569.
- Ndeddy Aka, R. J., & Babalola, O. O. (2016). Effect of bacterial inoculation of strains of Pseudomonas aeruginosa, Alcaligenes feacalis and Bacillus subtilis on germination, growth and heavy metal (Cd, Cr, and Ni) uptake of Brassica juncea. International Journal of Phytoremediation, 18(2), 200-209.
- Nwachukwu, S. U., & Osuji, L. C. (2017). Bioremediation of petroleum contaminated soil using organic wastes as amendments. Nigerian Society for Microbiology, 22(2), 1781-1792.
- Obi, L. U., Atagana, H. I., & Adeleke, R. A. (2016). Isolation and characterisation of crude oil sludge degrading bacteria. SpringerPlus, 5(1), 1946.
- Obun, F.E., Aliu, T.B., Popoola, D.A. and Raji, R.O., 2025. Toxicological Implications and Therapeutic Approaches in Heavy metal Exposure: Focus on Lead and Mercury, AROC In Natural Products Research 5 (1): 01-10
- Okoh, A. I. (2006). Biodegradation alternative in the cleanup of petroleum hydrocarbon pollutants. Biotechnology and Molecular Biology Reviews, 1(2), 38-50.
- Oyetibo, G. O., Ilori, M. O., Adebusoye, S. A., Obayori, O. S., & Amund, O. O. (2010). Bacteria with dual resistance to elevated concentrations of heavy metals and antibiotics in Nigerian contaminated systems. Environmental Monitoring and Assessment, 168(1-4), 305-314.
- Prasad, A. S., & Rao, K. V. B. (2014). Aerobic biodegradation of azo dye by Bacillus cohnii MTCC 3616; an obligately alkaliphilic bacterium and toxicity evaluation of metabolites by different bioassay systems. Applied Microbiology and Biotechnology, 98(16), 7241-7253.
- Rani, A., & Goel, R. (2009). Strategies for crop improvement in contaminated soils using metal-tolerant bioinoculants. In Microbial strategies for crop improvement (pp. 85-104). Springer, Berlin, Heidelberg.
Saravanan, V. S., Madhaiyan, M., & Thangaraju, M. (2007). Solubilization of zinc compounds by the diazotrophic, plant growth promoting bacterium Gluconacetobacter diazotrophicus. Chemosphere, 66(9), 1794-1798. - Shobowale, K. O., Suleiman A., Badmus, K. O., Aliu, T. B., Bello S.U, & Abdulkabir, A. O. (2025). The persistent threat of cadmium: From environmental exposure to multi-organ toxicity and carcinogenesis. AROC in Pharmaceutical and Biotechnology, 5(2), 18–26. https://doi.org/10.53858/arocpb05021826
- Sharma, S. (2012). Bioremediation: Features, strategies and applications. Asian Journal of Pharmacy and Life Science, 2(2), 286-293.
- Singh, D. K. (2008). Biodegradation and bioremediation of pesticide in soil: Concept, method and recent developments. Indian Journal of Microbiology, 48(1), 35-40.
- Ullah, A., Heng, S., Munis, M. F. H., Fahad, S., & Yang, X. (2015). Phytoremediation of heavy metals assisted by plant growth promoting (PGP) bacteria: A review. Environmental and Experimental Botany, 117, 28-40.
- Verma, S., & Kuila, A. (2019). Bioremediation of heavy metals by microbial process. Environmental Technology & Innovation, 14, 100369.
- Wuana, R. A., & Okieimen, F. E. (2011). Heavy metals in contaminated soils: A review of sources, chemistry, risks and best available strategies for remediation. ISRN Ecology, 2011, 402647.
- Yadav, K. K., Gupta, N., Kumar, A., Reece, L. M., Singh, N., Rezania, S., & Khan, S. A. (2018). Mechanistic understanding and holistic approach of phytoremediation: A review on application and future prospects. Ecological Engineering, 120, 274-298.
- Zhu, X., Li, W., Zhan, L., Huang, M., Zhang, Q., & Achal, V. (2016). The large-scale process of microbial carbonate precipitation for nickel remediation from an industrial soil. Environmental Pollution, 219, 149-155.